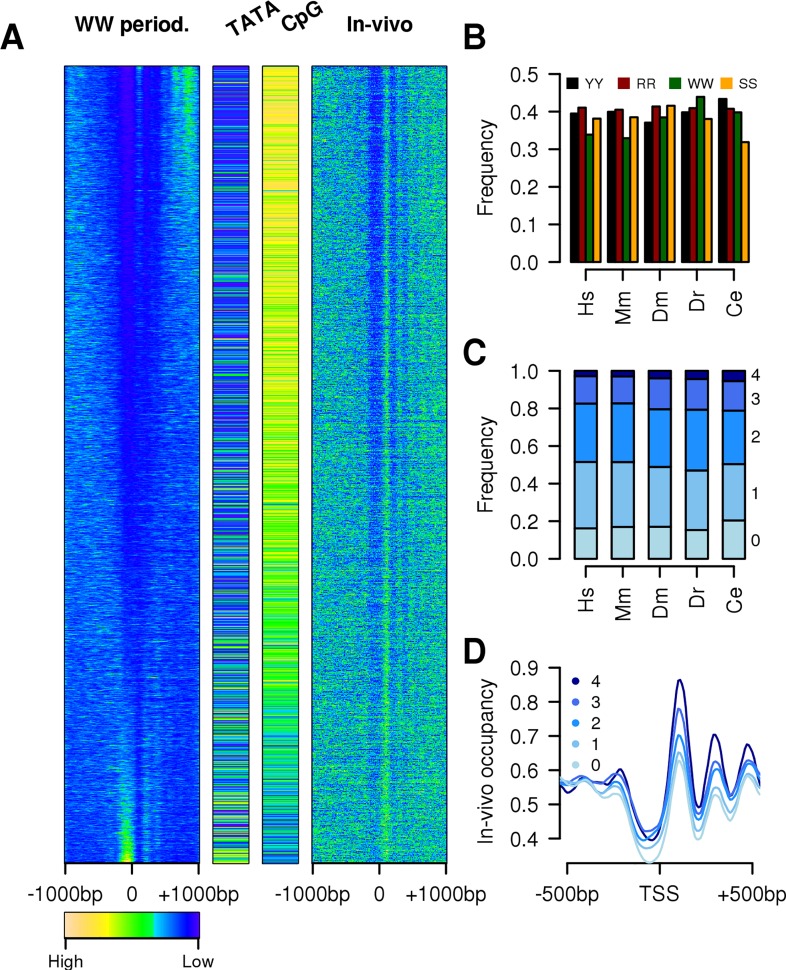
Fig 1. Effects of dinucleotides periodicity on chromatin.
(A) Intensity of 10 bp WW periodicity calculated using a Fourier transform in a sliding window of 150 bp (10 bp shift) on a 2 kb region around all human promoters (left-hand side) compared to the in-vivo nucleosome occupancy profiles derived from MNase-seq reads counts in the same regions (right-hand side); Boolean TATA-box and CpG islands classifications are based on: TATA-box has to be found at position -30 to -25 bp from the TSS whereas CpG islands have to cover the TSS. Promoters were ordered according to their correlation between the intensity of the 10 bp WW periodicity and the average in-vivo nucleosome distribution in the region -1000 bp to 1000 bp from the TSS. Each line corresponds to the average values of 10 promoters. (B) Fraction of promoters showing low intensity of 10 bp dinucleotide frequencies in the NFR and high intensity in the N+1 region for the 4 dinucleotides tested (concordant signal). (C) Cumulative fraction of promoters (indicated with the numbers on the right) with concordant signals for the four dinucleotides. (D) Average distribution of nucleosomes around human promoters stratified by the number of their concordant signals.

