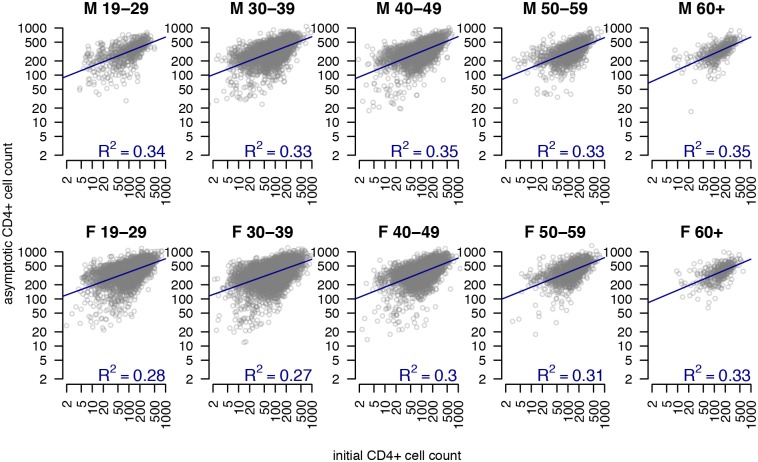
Fig 3. Initial CD4+ cell count and asymptotic CD4+ cell count by age and sex.
For each sex and age grouping, these panels show estimated asymptotic CD4+ count versus estimated CD4+ count at treatment initiation, as fitted in the best fit asymptotic non-linear mixed effects regression model of CD4+ counts over time for patients within the outpatient monitoring system of the National AIDS Control Program in Tanzania. Each circle represents one patient. Blue lines show fitted linear regressions with value in bottom right of each panel showing the R2 for this correlation.

