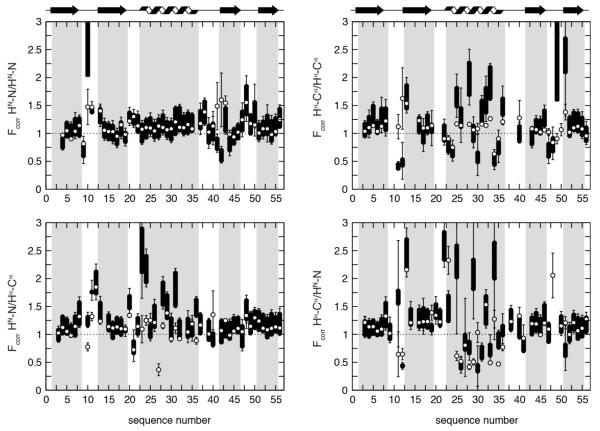
Fig. 4. Residue specific Fcorr values for GB3.
Motional correlation between and among HN–N and Hα–Cα bonds in GB3. Fcorr versus residue numbers are shown for HNi–Ni/Hαi–Cαi and HNi–Ni/Hαi-1–Cαi-1 on the left top and bottom, respectively, and for HNi–Ni/HNi+1–Ni+1 and Hαi–Cαi/Hαi-1–Cαi-1 on the right top and bottom. Black thick bars connect the lower Fcorr estimate from the iDIDC order parameters with the higher estimate from the ORIUM order parameters. The error bars indicate the propagated error from the CCRs and order parameters. If a value or an error is not available from a specific CCR rate or SRDC data set the bar is calculated as outlined in the Supporting Information. The white points indicate the Fcorr calculated from the ensemble that was restrained with the CCR and RDC data. Errors for this Fcorr are the RMSD for the Fcorr from 20 independent ensembles.

