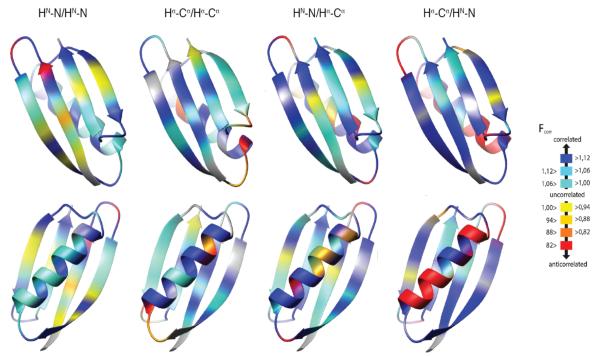
Fig. 5. Residue specific Fcorr values for GB3 from structure calculations.
HN–N/HN–N, Hα–Cα/Hα–Cα, and intraresidual and sequential HN–N/Hα–Cα Fcorr are mapped on 3D ribbon representations of GB3. The β-sheet is in the front in the top row, and the α helix in the bottom row. The plots were prepared with the program MolMol.72

