
Fig. 2. Disruption of SDI1 and SDI2 enhances the GSL accumulation.
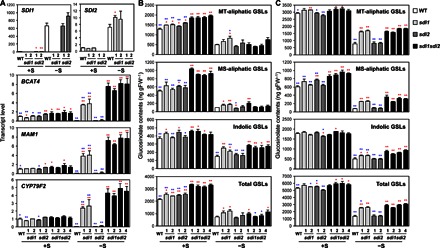
(A) Transcript levels of SDI1, SDI2, and three mGSL biosynthetic genes (BCAT4, MAM1, and CYP79F2) in roots of WT (white bars), sdi1 (pale gray bars), sdi2 (dark gray bars), and sdi1sdi2 (black bars) plants analyzed by qRT-PCR. (B and C) MT-aliphatic, MS-aliphatic, indolic, and total GSL contents in shoot (B) and root (C) tissues of WT, sdi1, sdi2, and sdi1sdi2. Plants were grown under +S or −S conditions. Bars and error bars show means and SE of triplicates. **P < 0.01, *P < 0.05, significant differences detected using Student’s t test between WT and T-DNA insertion mutants (red) and those between four lines of sdi1sdi2 and other plant lines (blue). ng gFW−1, nanogram per gram fresh weight.