
Fig. 4. Perturbation of SDI1 and SDI2 influences the accumulation of primary sulfur metabolites.
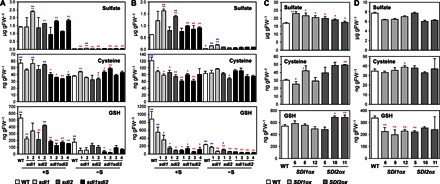
(A and B) Sulfate, Cys, and GSH content in shoot (A) and root (B) tissues of WT (white bars), sdi1 (pale gray bars), sdi2 (dark gray bars), and sdi1sdi2 (black bars) plants grown under +S or −S conditions. **P < 0.01, *P < 0.05, significant differences detected using Student’s t test between WT and T-DNA insertion mutants (red) and those between four lines of sdi1sdi2 and other plant lines (blue). (C and D) Sulfate, Cys, and GSH content in shoot (C) and root (D) tissues of WT (white bars), SDI1ox (pale gray bars), and SDI2ox (dark gray bars) plants grown under +S conditions. Bars and error bars show means and SE of triplicates. **P < 0.01, *P < 0.05, significant differences detected using Student’s t test between WT and overexpression lines.