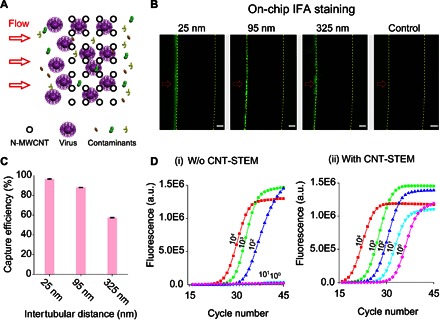
Fig. 4. Enrichment and concentration of virus swab samples by CNT-STEM.

(A) Top-view illustration of viruses passing through and captured by the N-MWCNT array. (B) On-chip IFA staining of captured H5N2 AIV inside CNT-STEMs with 25-, 95-, and 325-nm intertubular distances. Fluorescence microscopy images of the CNT-STEMs. Red arrows indicate the flow of direction. Yellow dotted lines delineate the contours of the N-MWCNT structures. The control sample was allantoic fluid without viruses. Scale bars, 25 μm. (C) Capture efficiency of CNT-STEMs with intertubular distances of 25, 95, and 325 nm measured by rRT-PCR (n = 6). (D) Examples of rRT-PCR AIV detection curves for virus titers of 104, 103, 102, 101, and 100 EID50/ml without (i) and with (ii) CNT-STEM enrichment. a.u., arbitrary units.
