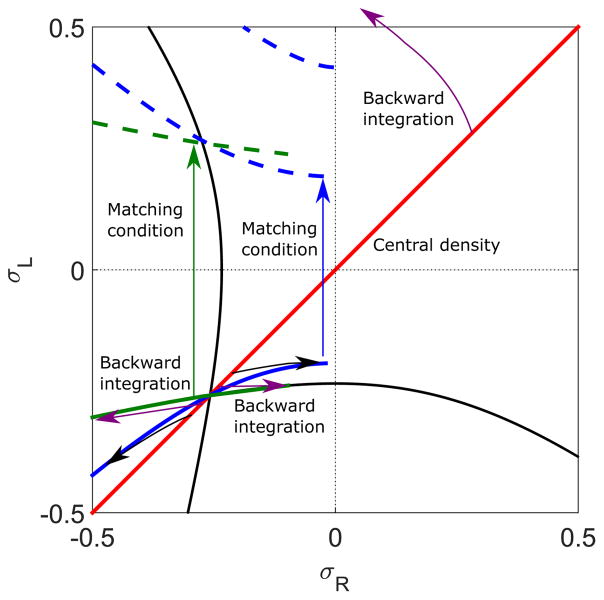
FIG. 11.
Illustration of the effects of changing motor speed on the LH phase boundary. High motor speed (5 μm s−1) shown in blue, low motor speed 0.5 μm s−1 shown in green. The red line indicates the central density, which lies on the σR = σL line for symmetric boundary conditions. Backward integration from this line (black and purple arrows) to gives the thick blue and green lines. Applying the matching condition to σL and σR (blue and green arrows) gives the dashed blue and green lines. These are the phase boundaries of the LH phase. The solid black lines are trajectories which pass through the Langmuir isotherm. For lower motor speed, backward-integrated line moves closer to the black line. The phase boundary of the LH and H phases is outside of the lanes. The switching rate is 0.1 s−1, the bulk motor concentration c = 200 nM; other parameters are the reference values of Table I.

