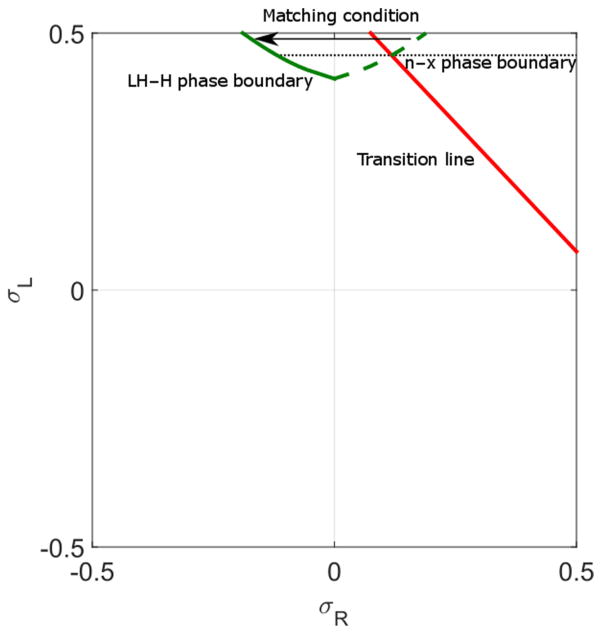
FIG. 14.
Illustration of calculation of phase boundaries of local maximum and minimum phases. The dashed green line is obtained from backward integration of the σR = σL line to . The green line indicates the LH phase boundary determined by the matching condition, where the right of the line is the H phase. The red line is the transition line. Since the H phase satisfies the right boundary condition, the starting point of the density profile depends on σL value. Therefore, the phase boundary of the local maximum and minimum phase is a horizontal line that intersects the green dashed line and the transition line. The local minimum phase is above the black dashed line. The switching rate is 0.1 s−1, bulk motor concentration c = 200 nM, and motor speed is 5 μm s−1; other parameters are the reference values of Table I.

