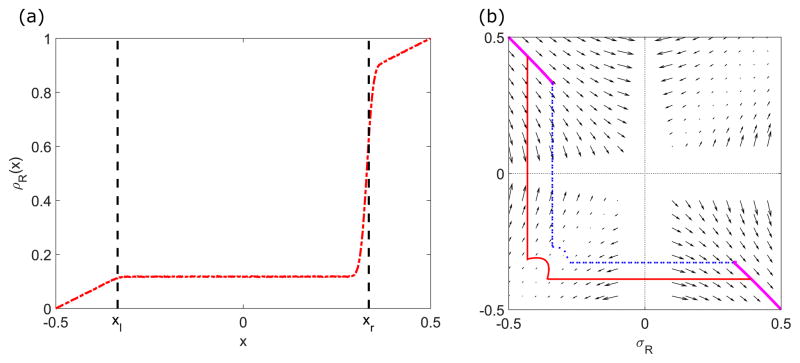
FIG. 15.
Illustration of the density profile (a) and hypothetical phase-plane trajectories (b) in the LH phase. (b) The thick purple curves indicate the density profile starting from the boundary conditions, and the dashed blue and solid red curves are two different hypothetical trajectories which locally obey Eqs. (7), (8), and (21). The parameters are s = 0.44 s−1, c = 200 nM, v = 5 μm s−1, kon = 2.7 × 10⁻⁶ nM−1 s−1, and koff = 0.00169 s−1; other parameters are the reference values of Table I. Arrows in (b) indicate the vector field, which has the mathematical form of Eqs. (12) and (13).

