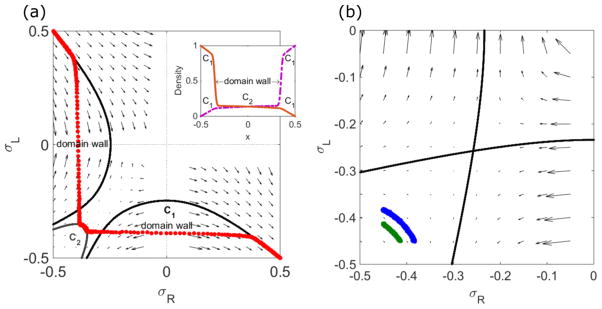
FIG. 4.
Effects of domain walls and finite size on density profiles. Left, determination of domain wall positions in the phase-plane trajectory and the density profile (inset). Red points show kMC simulation results. The boundary points are and . The solution locally follows the flow, which cannot connect the boundary points without crossing the lines with σR = 0 and σL = 0 where the velocity is ill defined. Crossing these lines uses the matching condition to connect to another exact solution curve, introducing a domain wall. Inset shows the density profiles of ρR (purple, dashed) and ρL (brown, solid). The sharp transitions in ρR and ρL indicate the domain walls. There are three regions which are separated by two domain walls: regions near ends follow C1, and the region at the center is described by C2. Right, finite-size constraint. The blue points (longer curve) are kMC simulation results for N = 1000, and the green (shorter curve) N = 500. For a larger number of sites, the dimensionless motor speed is smaller, moving the solution closer to the LI. The switching rate is 0.44 s−1(left), 0.1 s−1(right), the bulk motor concentration c = 200 nM, and the motor speed 5 μm s−1; other parameters are the reference values of Table I. Arrows indicate the vector field, which has the mathematical form of Eqs. (12) and (13).

