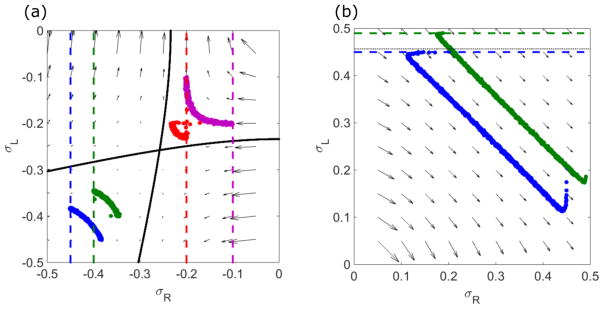
FIG. 8.
Example phase-plane trajectories of L and H phases. (a) L phase. The starting and ending points are (σR, σL) = (−0.45, −0.4) and (−0.4, −0.45) (blue), (−0.4, −0.45) and (−0.45, −0.4) (green), (−0.2, −0.1) and (−0.1, −0.2) (red), and (−0.1, −0.2) and (−0.2, −0.1) (purple). The dashed lines show that the L phase obeys the left boundary conditions, where the positions are σR = −0.45 (blue), σR = −0.4 (green), σR = −0.2 (red), and σR = −0.1 (purple). (b) H phase. The starting and ending points are (σR, σL) = (0.3, 0.45) and (0.45, 0.3) (blue), (0.2, 0.49) and (0.49, 0.2) (green). The dashed lines show that the H phase obeys the right boundary conditions, where the positions are σL = 0.45 (blue) and σL = 0.49 (green). The black dashed line , the critical density ρc (see text) of the local minimum and local maximum phases. The switching rate is 0.1 s−1, bulk motor concentration c = 200 nM, and motor speed 5 μm s−1; other parameters are the reference values of Table I. Arrows indicate the vector field, which has the mathematical form of Eqs. (12) and (13).

