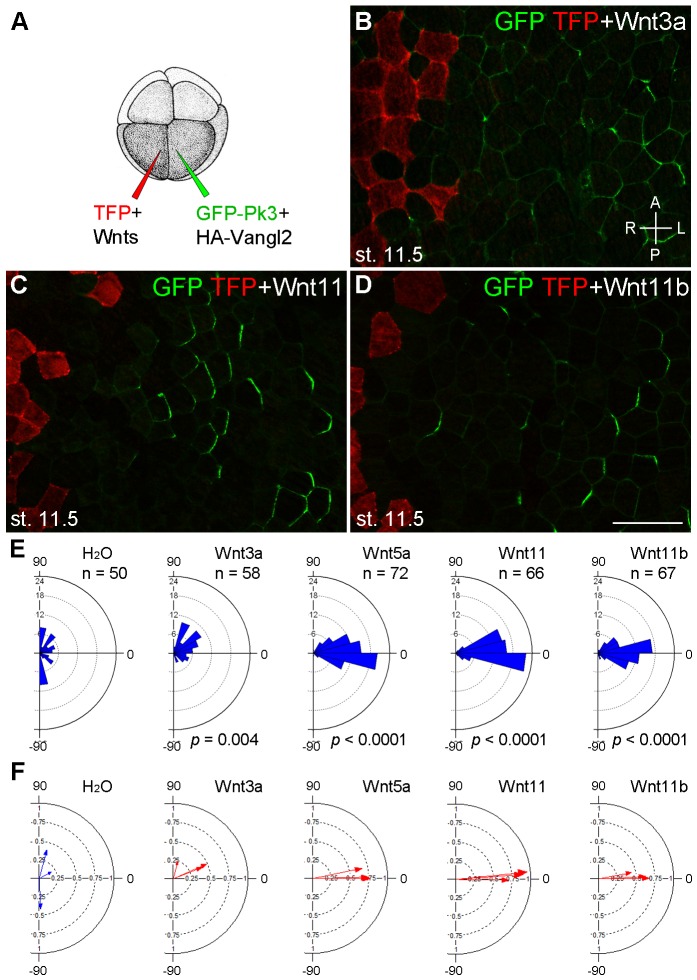
Figure 4. Establishment of Pk3 polarity in response to different Wnt ligands.
(A) Experimental scheme. RNAs encoding GFP-Pk3 and mouse HA-Vangl2 (150 pg each) were injected into the left animal-ventral blastomere of eight-cell embryos, followed by coinjection of a Wnt RNA (500 pg) and TFP RNA into the right animal-ventral blastomere. (B–D) Cell orientation in stage 11.5 ectoderm of embryos injected with Wnt3a (B), Wnt11 (C) and Wnt11b (D) RNAs. The antero-posterior and left-right axes are indicated. Scale bar, 50 µm. (E) Rose diagrams show Pk3 patch orientation in clones adjacent to control (H2O) or Wnt-expressing clones. See Figure 3I for details. n, number of scored cells. p values were obtained using Chi-squared test. (F) Polar plots derived from (E) depict the average Pk3 orientation in individual embryos. Arrow length is 1 minus the circular variance around the mean. Data were collected from two independent experiments.

