. 2016 Sep 9;5:e16996. doi: 10.7554/eLife.16996

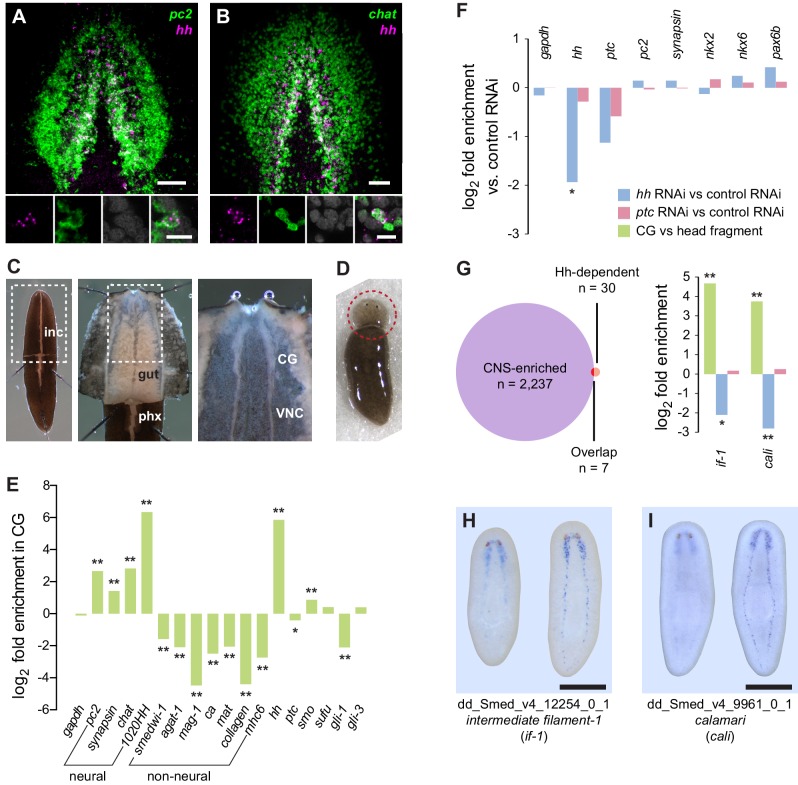
Figure 1. Perturbation of Hh signaling affects gene expression in the cephalic ganglia.

(AB) Double fluorescent RNA in situ hybridization (FISH) for hh (magenta) and neuronal markers (A) pc2 or (B) chat (green) in wild-type animals. Main panels show cephalic ganglia. Lower panels show high magnification images of, from left to right, hh (magenta), pc2 or chat (green), DAPI (gray), and merged channels from a representative double-positive neuron. (C) Excision of cephalic ganglia tissue from acid-killed animals for RNA isolation. The left panel shows incision in the dorsal epidermis. Middle panel shows detail of the boxed region in the left panel after removal of dorsal epidermis. The right panel shows the detail of the boxed region in the middle panel after removal of gut tissue overlying the cephalic ganglia and ventral nerve cords. Abbreviations: inc, incision; gut, gut branches; phx, pharynx; CG, cephalic ganglia; VNC, ventral nerve cords. See methods for dissection protocol. (D) Representative image of amputation used to collect tissue for generating the head fragment Illumina libraries. Circle indicates the portion of the animal taken for RNA isolation. (E) Bar graph depicting log2 fold enrichment of selected markers in cephalic ganglia transcriptome over the head fragment transcriptome. Experimentally-verified neural markers and non-neural markers identified by brackets. Average log2 fold enrichment of all 7 CNS genes listed in Figure 1—source data 2 in cephalic ganglia transcriptome is 2.57. Average log2 fold depletion of all 22 non-CNS genes listed in Figure 1—source data 2 in cephalic ganglia transcriptome is 1.22. Statistically significant log2 fold change indicated by asterisks (*padj≤0.05, **padj≤0.001). For a list of all analyzed genes, see Figure 1—source data 1. (F) Bar graph depicting log2 fold enrichment of transcript expression level in the cephalic ganglia tissue of hh(RNAi) animals (blue bars) or ptc(RNAi) animals (red bars) over cephalic ganglia tissue from control(RNAi) animals. (G) Intersection of CNS-enriched genes (n = 2237) and Hh-dependent genes (n = 30) reveals 7 CNS genes misregulated following Hh pathway perturbation. Bar graph shows CNS enrichment (green bar) and relative expression following RNAi of hh (blue bar) or ptc (red bar) for if-1 and cali (*padj≤0.05, **padj≤ 0.01). (HI) WISH for (H) if-1 and (I) cali. Dorsal surface shown on left, ventral surface shown on the right. Anterior up, maximum intensity projection of the ventral domain shown for A, B. Anterior up for H, I. Scale bars: 50 um for overviews, 10 um for insets for A, B; 500 um for H, I.

DOI: http://dx.doi.org/10.7554/eLife.16996.002

Figure 1—source data 1. Neuronal markers used in RNA-seq analysis and co-expression studies.
DOI: 10.7554/eLife.16996.003
Figure 1—source data 2. Enrichment of neuronal markers and depletion of non-neuronal markers in cephalic ganglia tissue libraries.
For each gene, general expression pattern and log2 fold enrichment of CNS tissue expression over head fragment expression is listed. CNS, central nervous system; GUT, intestinal tract; MUS, muscle layer; NB, neoblasts; NP, neuropil; NPH, nephridia; PCYM, parenchyma; PHX, pharynx; PR, photoreceptors; RIM, body peripheral edge. References for previously published genes are listed (Cebrià and Newmark, 2005; Collins et al., 2010; Currie and Pearson, 2013; Eisenhoffer et al., 2008; Fraguas et al., 2011; Lapan and Reddien, 2011, 2012; Petersen and Reddien, 2009; Reddien et al., 2005b; Rink et al., 2009; Scimone et al., 2011; Witchley et al., 2013; Zayas et al., 2010).
DOI: 10.7554/eLife.16996.004
Figure 1—source data 3. Genes with significant differential expression levels following inhibition of hh or ptc.
Criteria for selecting genes were (1) adjusted p-value (padj) of less than 0.05, (2) greater than 1000 RPKM, and (3) greater than 2-fold change in expression level either between control(RNAi) and hh(RNAi) or between control(RNAi) and ptc(RNAi). Annotations by best BLAST hit listed for each gene; "No Similarity" listed if no significant BLAST hit was found. Two genes, prog-1 and reticulocalbin-1, were described in planarians previously (Eisenhoffer et al., 2008; Zayas et al., 2010). Blue text indicates greater than 2-fold change in expression level. Green text indicates enrichment in CNS tissue versus whole head fragment.
DOI: 10.7554/eLife.16996.005
Figure 1—source data 4. Accession numbers of protein sequences used in phylogenetic analysis of intermediate filament proteins.
Text in gray represents hypothetical proteins or sequences with high BLASTX similarity.
DOI: 10.7554/eLife.16996.006

Figure 1.

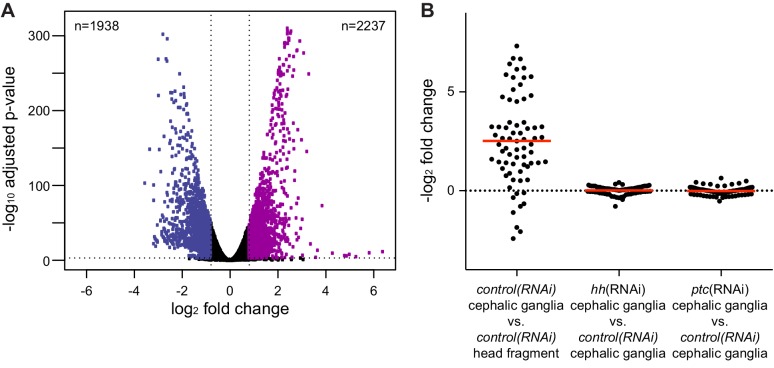
Figure 1—figure supplement 1. Analysis of RNA-seq libraries.

Figure 1—figure supplement 1.

(A) Volcano plot of differential expression between head fragment transcriptome and cephalic ganglia transcriptome. Dots represent the magnitude of differential expression versus the significance for each gene with an average RPKM over 100. A horizontal dotted line indicates significance cutoff and vertical lines indicate the differential expression magnitude cutoff. Number of genes significantly enriched (purple dots) or depleted (blue dots) in cephalic ganglia tissue listed in the upper right and left corners, respectively. (B) Column scatter plot of differential expression of neural markers between conditions. Each dot represents one neural marker. The solid red line indicates mean log2 fold change of all analyzed neural markers for each condition.
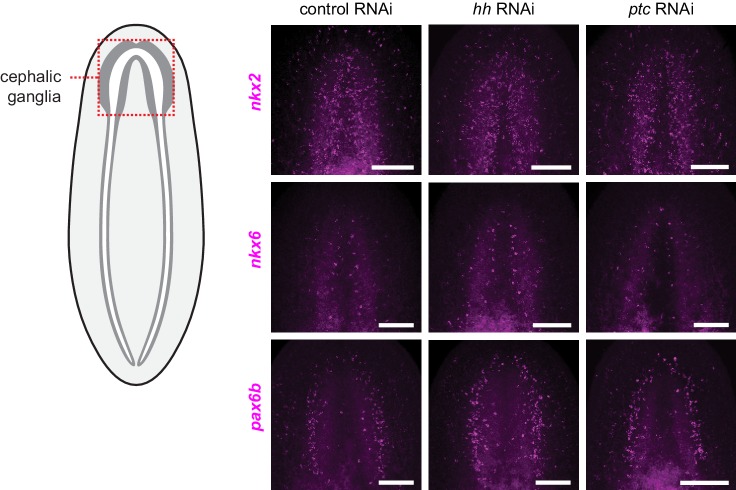
Figure 1—figure supplement 2. Hh signaling pathway perturbation does not affect regional expression of transcription factors in the central nervous system.

Figure 1—figure supplement 2.

FISH of orthologs of vertebrate CNS development transcription factors following perturbation of Hh signaling pathway components. Schematic indicates a region of the animal displayed in images. Inhibition of hh (center column) or ptc (right column) shows no change in the expression pattern of nkx2 (top row), nkx6 (middle row), or pax6b (bottom row) from controls (left column). Anterior up, maximum intensity projection of ventral side shown. Scale bars: 100 um for all.
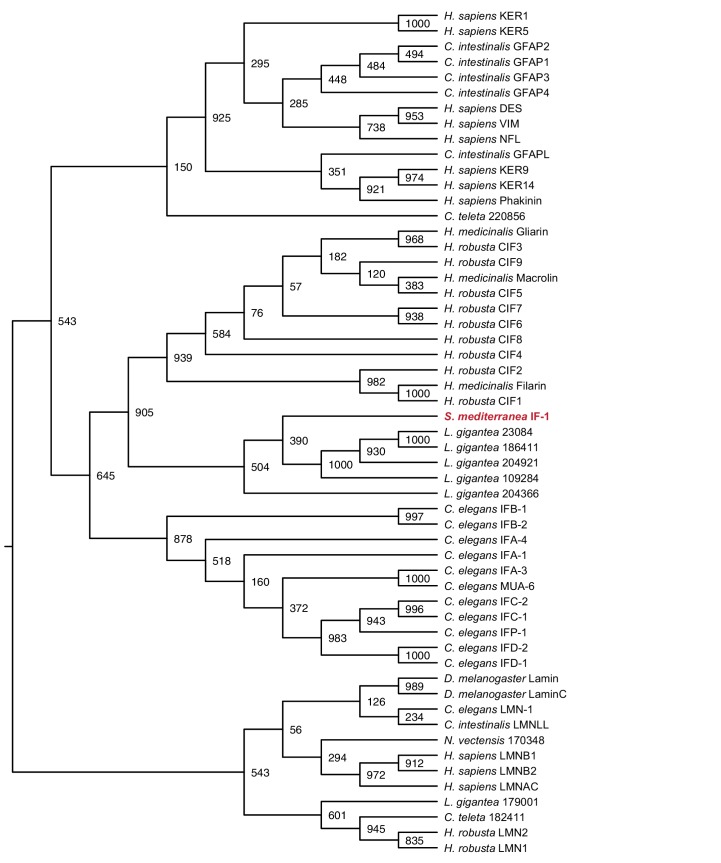
Figure 1—figure supplement 3. Maximum likelihood cladogram for cytoplasmic intermediate filaments.

Figure 1—figure supplement 3.

S. mediterranea IF-1 clusters with Protostome cytoplasmic intermediate filaments, which diverged prior to the vertebrate radiation of multiple intermediate filament types. Nuclear intermediate filament proteins were used as an outgroup to root the tree. Bootstrap values listed at branch junctions. Accession numbers of protein sequences used in the analysis listed in Figure 1—source data 4.