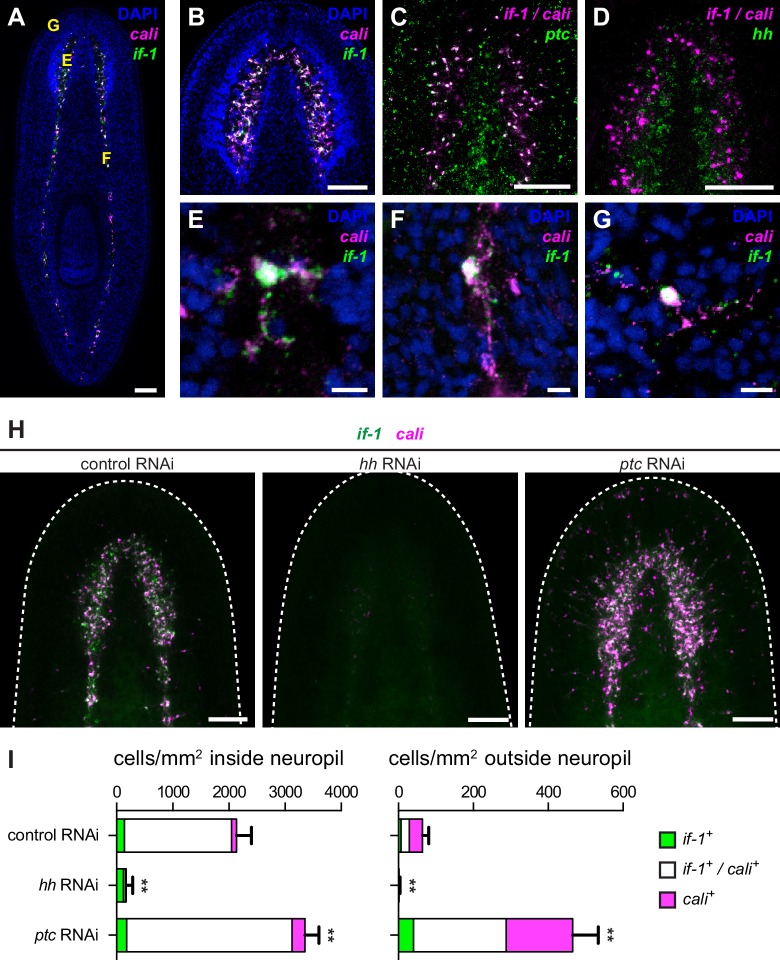
Figure 2. Expression of if-1 and cali in neuropil cells is dependent on Hh signaling.
(A) Double FISH for if-1 (green) and cali (magenta) in wild-type animals. Cells co-expressing both markers are located in the cell body-sparse neuropil of the cephalic ganglia and ventral nerve cords. The cell body-rich cortical region is labeled by DAPI (blue). Yellow letters indicate regions detailed in E–G. (B) Double FISH for if-1 and cali in cephalic ganglia neuropil. (C) Double FISH for if-1/cali (magenta) and ptc (green) indicates co-expression of the genes. Probes for if-1 and cali were combined into a single channel (denoted if-1/cali) to improve coverage and signal intensity. 97.8 ± 2.1% of if-1+/cali+ cells in the neuropil and 100% of if-1+/cali+ cells outside the neuropil expressed ptc. (D) Double FISH for if-1/cali (magenta) and hh (green) indicates lack of co-expression. (E–G) Single if-1+/cali+ cells in the (E) cephalic ganglion neuropil, (F) ventral nerve cord, and (G) head rim. (H) Double FISH for if-1 (green) and cali (magenta) in animals following inhibition of a control gene, hh, or ptc. White dotted line delineates the edge of animal. (I) Quantification of the results from (H), with distribution of if-1+ only cells (green), cali+ only cells (magenta), and if-1+/cali+ cells (white). Within the neuropil, cells expressing one or both markers are present at 2135.6 ± 265.8 cells/mm2 in control(RNAi) conditions (n = 5 animals), 169.3 ± 118.6 cells/mm2 in hh(RNAi) conditions (n = 4 animals), and 3354.0 ± 249.5 cells/mm2 in ptc(RNAi) conditions (n = 5 animals). Differences were significant in both hh RNAi and ptc RNAi (**p<0.001, two-tailed t test). In the head not including the neuropil region, cells expressing one or both markers are present at 64.4 ± 16.6 cells/mm2 in control(RNAi) conditions (n = 5 animals), 1.5 ± 2.9 cells/mm2 in hh(RNAi) conditions (n = 4 animals), and 465.4 ± 68.7 cells/mm2 in ptc(RNAi) conditions (n = 5 animals). Differences were significant in both hh RNAi and ptc RNAi (**p<0.001, two-tailed t test). Anterior up, ventral side shown for A–D, H. Scale bars: 100 um for A–D, H; 10 um for E–G.
DOI: http://dx.doi.org/10.7554/eLife.16996.010


