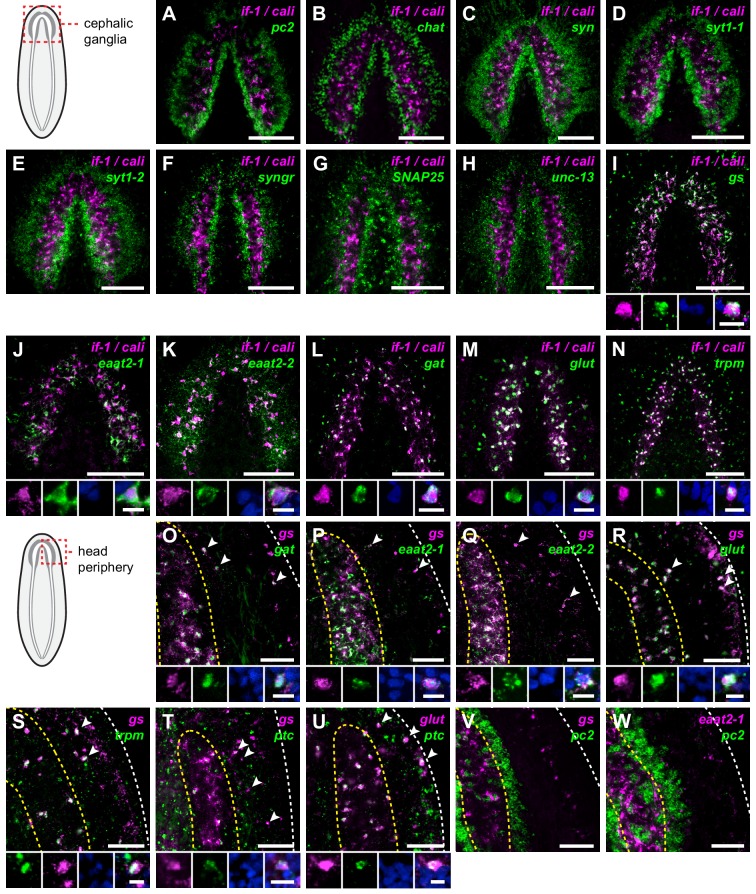
Figure 3. if-1+/cali+ cells express neurotransmitter reuptake and metabolism genes.
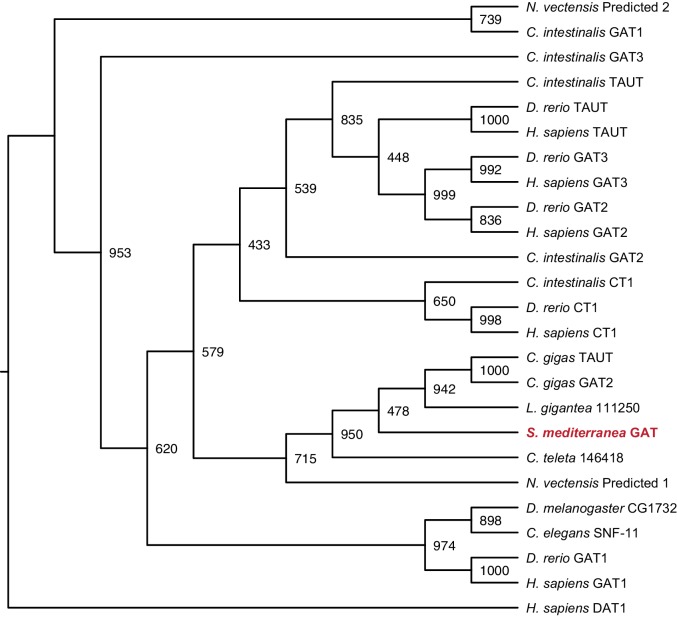
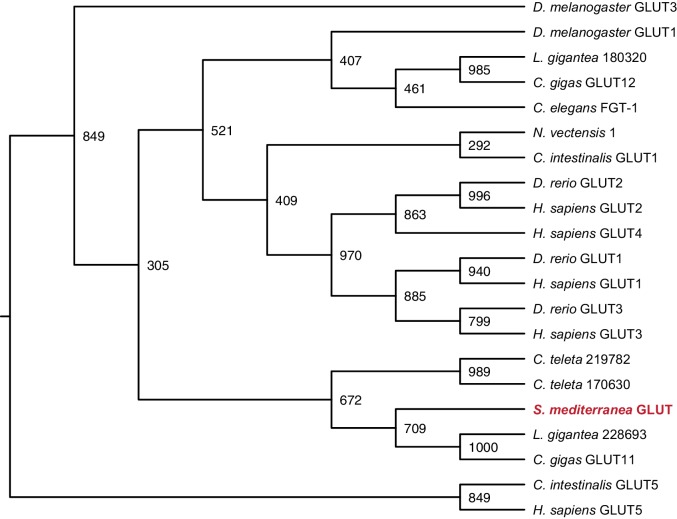
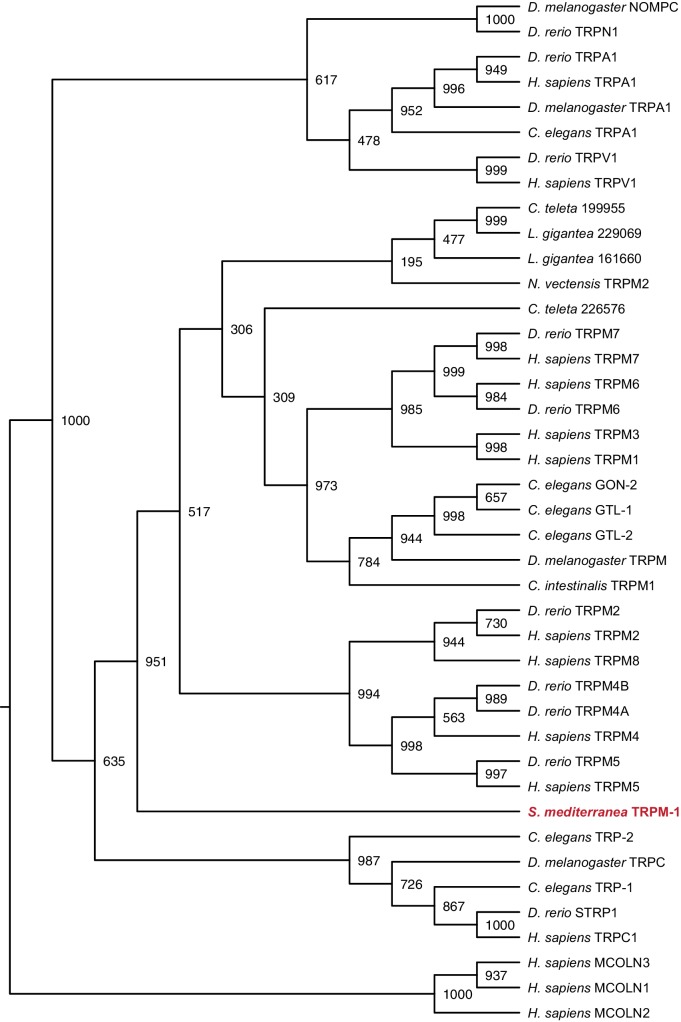
(A–N) Schematic indicates region of focus. (A–H) Double FISH of if-1/cali (magenta) and neural markers (A) pc2, (B) chat, (C) syn, (D) syt1-1, (E) syt1-2, (F) syngr, (G) SNAP25, and (H) unc-13 (green). No co-expression was observed between neural markers and if-1 and cali. (I–N) Double FISH of if-1/cali (magenta) with orthologs of vertebrate astrocyte markers (I) gs, (J) eaat2-1, (K) eaat2-2, (L) gat, (M) glut, and (N) trpm (green). Lower panels show high magnification images of, from left to right, if-1/cali (magenta), astrocyte marker ortholog (green), DAPI (blue), and merged channels from a representative double-positive cell. (O–W) Schematic indicates region of focus. The images show one hemisphere of the cephalic ganglia and the lateral parenchymal space. White dotted line delineates the edge of animal. Yellow dotted line delineates borders of the neuropil. (O–S) Double FISH of gs (magenta) with (O) gat, (P) eaat2-1, (Q) eaat2-2, (R) glut, and (S) trpm (green). 98.7 ± 1.4% of glut+ cells in the neuropil and 99.7 ± 0.7% of glut+ cells outside the neuropil expressed gs. 96.8 ± 4.6% of trpm+ cells in the neuropil and 93.8 ± 4.5% of trpm+ cells outside the neuropil expressed gs. Arrowheads denote double-positive cells outside the neuropil. Lower panels show high magnification images of, from left to right, gs (magenta), astrocyte marker ortholog (green), DAPI (blue), and merged channels from a representative double-positive cell. (T–U) Double FISH of ptc (green) with (T) gs and (U) glut (magenta). 99.3 ± 0.7% of glut+ cells in the neuropil and 90.4 ± 4.5% of glut+ cells outside the neuropil expressed ptc. Arrowheads denote double-positive cells. Lower panels show high magnification images of, from left to right, gs or glut (magenta), ptc (green), DAPI (blue), and merged channels from a representative double-positive cell. (V–W) Double FISH of pc2 (green) with (V) gs and (W) eaat2-1 (magenta). No double-positive cells were observed in both cases. Anterior up, ventral side shown for all. Maximum intensity projections shown for I–N. Scale bars: 100 um for overviews, 10 um for insets for A–N; 50 um for overviews, 10 um for insets for O–W.
DOI: http://dx.doi.org/10.7554/eLife.16996.014

