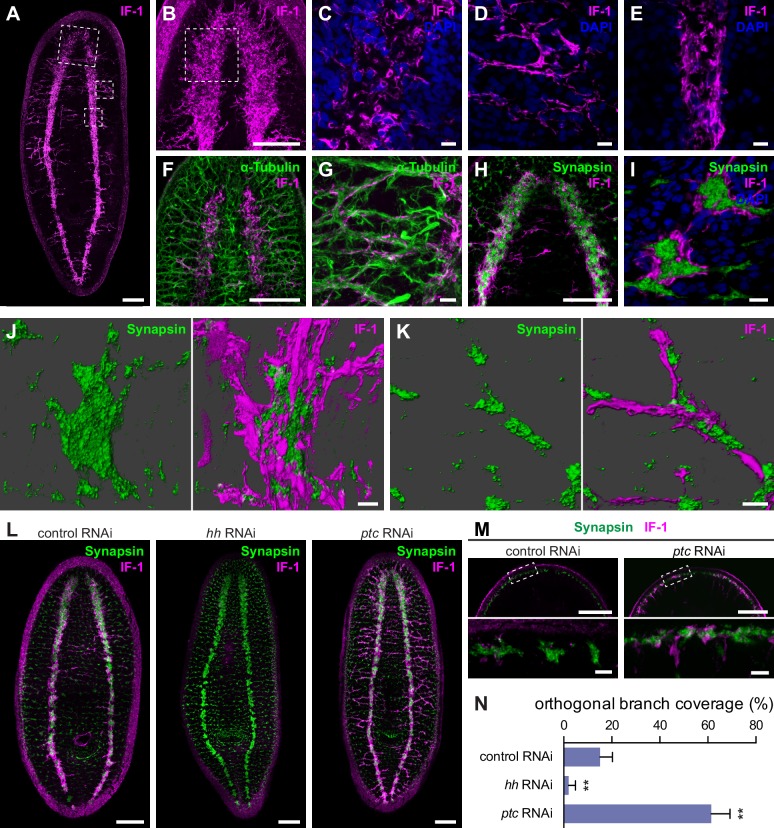
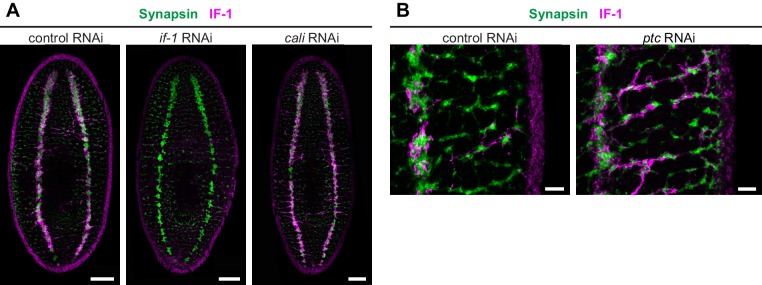
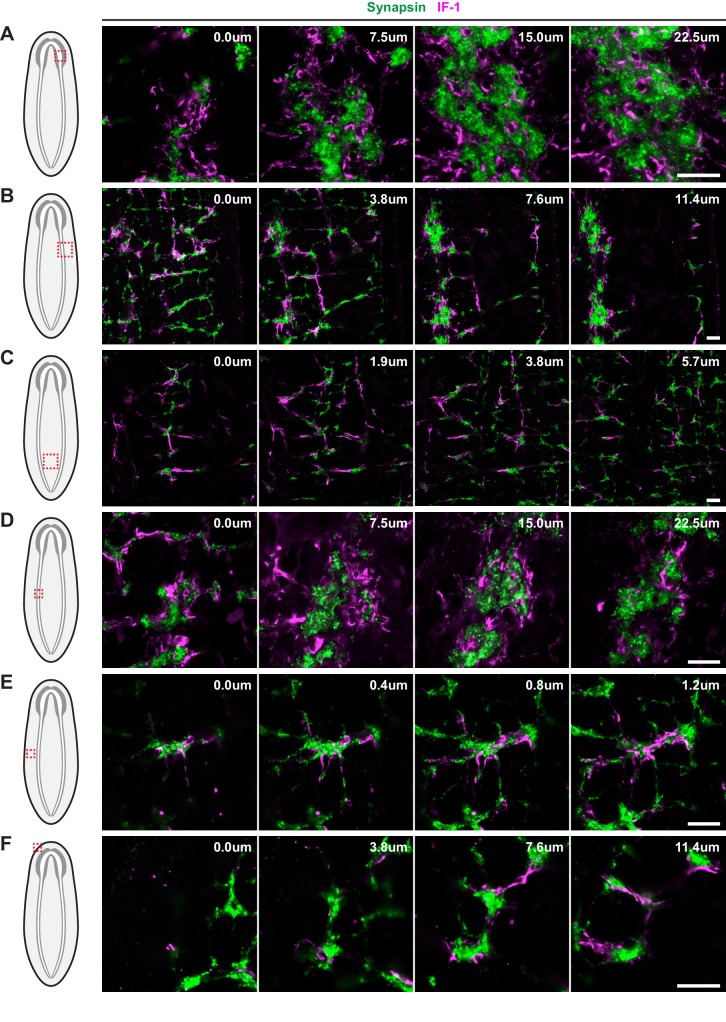
Figure 4. if-1+/cali+ cells have processes that closely associate with neurons.
(A) Whole-mount immunofluorescence for IF-1 protein (magenta) in wild-type untreated animals. (B) Maximum intensity projection of IF-1 localization (magenta) in the cephalic ganglia. Depicted region is indicated by top dotted box in panel A. (C) IF-1 localization (magenta) in the cephalic ganglion neuropil. Depicted region is indicated by dotted box in panel B. (D) IF-1 localization in the lateral ventral parenchyma. Depicted region is indicated by middle dotted box in panel A. (E) IF-1 localization in the ventral nerve cord. Depicted region is indicated by bottom dotted box in panel A. (F–G) Immunofluorescence of IF-1 (magenta) and α-Tubulin (green) in (F) the head and (G) the lateral ventral parenchyma of wild-type untreated animals. (H–I) Immunofluorescence of IF-1 (magenta) and Synapsin (green) in (H) the head and (I) the ventral nerve cord of wild-type untreated animals. (J–K) 3D renderings of confocal stacks of (J) a synaptic glomerulus in the ventral nerve cord or (K) an orthogonal branch labeled with anti-IF-1 (magenta) and anti-Synapsin (green). Image on left is Synapsin only and image on right is Synapsin and IF-1. (L) Immunofluorescence of IF-1 (magenta) and Synapsin (green) following inhibition of hh, ptc, or a control gene. (M) Detail of immunofluorescence of IF-1 (magenta) and Synapsin (green) in the head rim of animals following inhibition of a control gene or ptc. Dotted box in top row refers to the corresponding image in the bottom row. (N) Quantification of hh(RNAi) and ptc(RNAi) phenotypes based on percentage of orthogonal axon bundles in contact with IF-1+ processes. In control(RNAi) animals, 15.1 ± 5.1% of orthogonal axon bundles contained IF-1+ processes (n = 5 animals). In hh(RNAi) animals, 2.1 ± 2.8% of orthogonal axon bundles contained IF-1+ processes (n = 5 animals). In ptc(RNAi) animals, 61.4 ± 7.8% of orthogonal axon bundles contained IF-1+ processes (n = 4 animals). The differences between both hh RNAi and ptc RNAi vs control were statistically significant (**p<0.001, two-tailed t test). Anterior up, ventral side shown for all. Scale bars: 100 um for A, B, F, H, L, top row of M; 10 um for C, D, E, G, I, J, K, bottom row of M.
DOI: http://dx.doi.org/10.7554/eLife.16996.026


