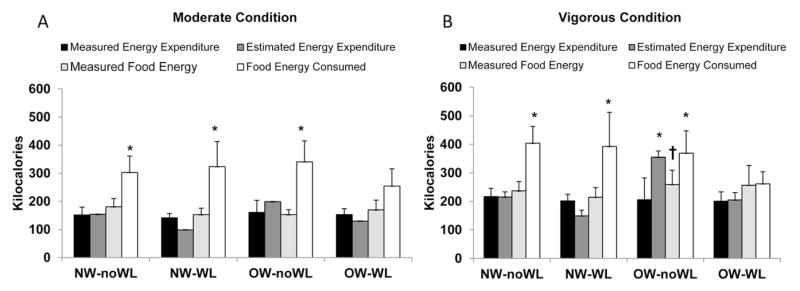
Figure 1.
Measured exercise energy expenditure (black bars), estimated exercise energy expenditure (dark grey bars), measured food energy (light grey bars), and ad libitum energy intake (white bars) following moderate intensity exercise (Panel A) and vigorous intensity exercise (Panel B), according to BMI and weight loss status. Data is presented as mean ± standard error. NW = normal weight; OW = overweight/obese; WL = weight loss; * = significantly different from measured energy expenditure within a group (P<0.05). † = significantly different from estimated energy expenditure within a group (P<0.05).

