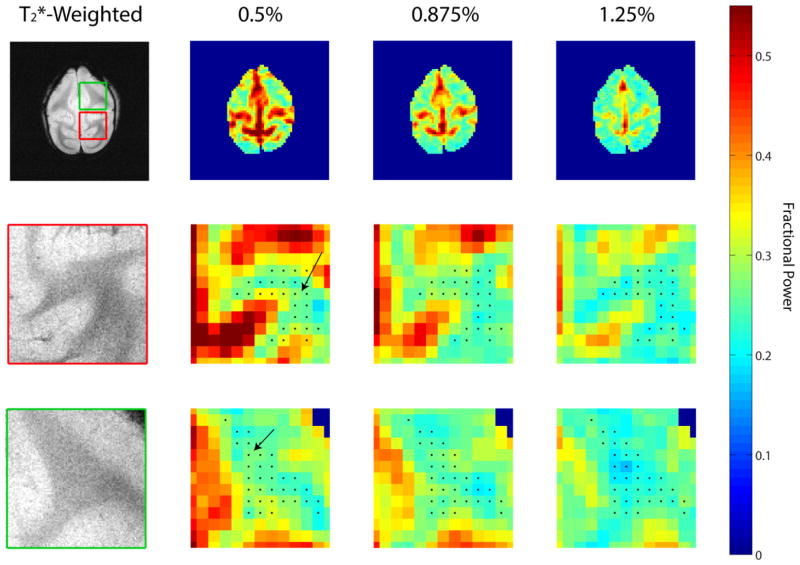
Figure 3.
Averaged fractional power maps for a selected axial slice from one of the monkeys across different isoflurane levels. The upper row (from left to right) presents T2*-weighted anatomical image with fractional power maps with increasing isoflurane levels 0.5%, 0.875% and 1.25%. The second and third row present enlarged views of the red and green boxes indicated on the T2*-weighted anatomical image. The black dots on the enlarged fractional power maps represent segmented white matter regions while the black arrows point to white matter regions of increased fractional power with lowered isoflurane level.

