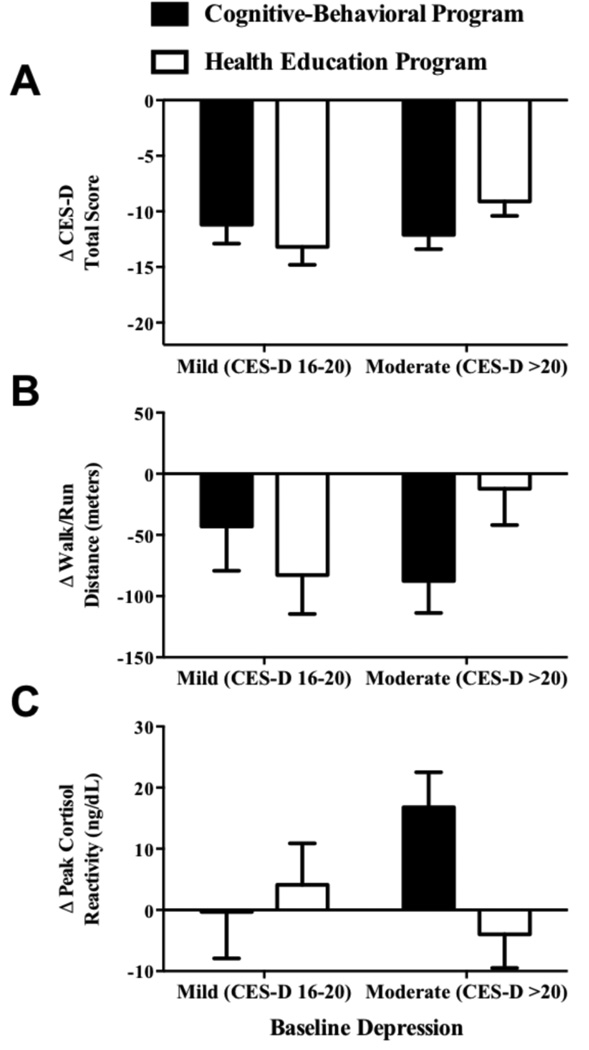
Figure 2.
Interaction of group by baseline depressive symptoms (CES-D: Center for Epidemiological Studies-Depression Scale) in predicting continuous changes from baseline to post-treatment in depressive symptoms (Panel A; p<0.05), walk/run distance (Panel B; p=0.04), and peak cortisol reactivity (Panel C; p=0.03). Estimates adjusted for baseline depressive symptoms (A), walk/run distance (B), or peak cortisol reactivity (C), and baseline age, puberty, race/ethnicity, baseline percent body fat, change in percent body fat, degree of diabetes family history, and group facilitator.

