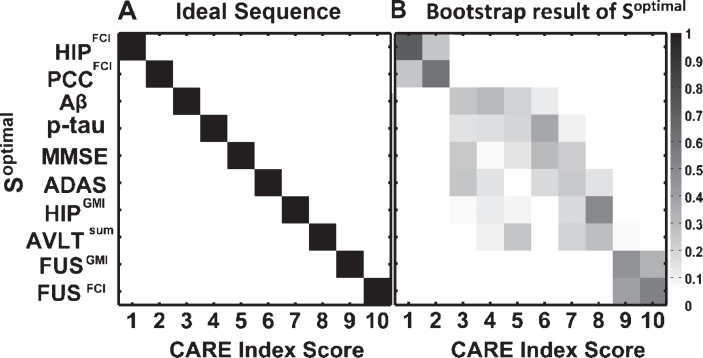
Fig.2.
Optimal temporal order, Soptimal, of the 10 AD biomarkers estimated by the EBP model. A) The y-axis shows the Soptimal and the x-axis shows the CARE index score at which the corresponding event occurred. B) Bootstrap cross-validation of the Soptimal. Each entry in the matrix represents the proportion of the Soptimal during 500 bootstrap samples. The proportion values range from 0 to 1 and correspond to color, from white to black. The CARE index scores with their corresponding biomarkers follow: 1, increased HIPFCI; 2, decreased PCCFCI; 3, decreased Aβ concentration; 4, increased p-tau concentration; 5, decreased MMSE score; 6, increased ADAS score; 7, decreased HIPGMI; 8, decreased AVLT score; 9, decreased FUSGMI; 10, increased FUSFCI.

