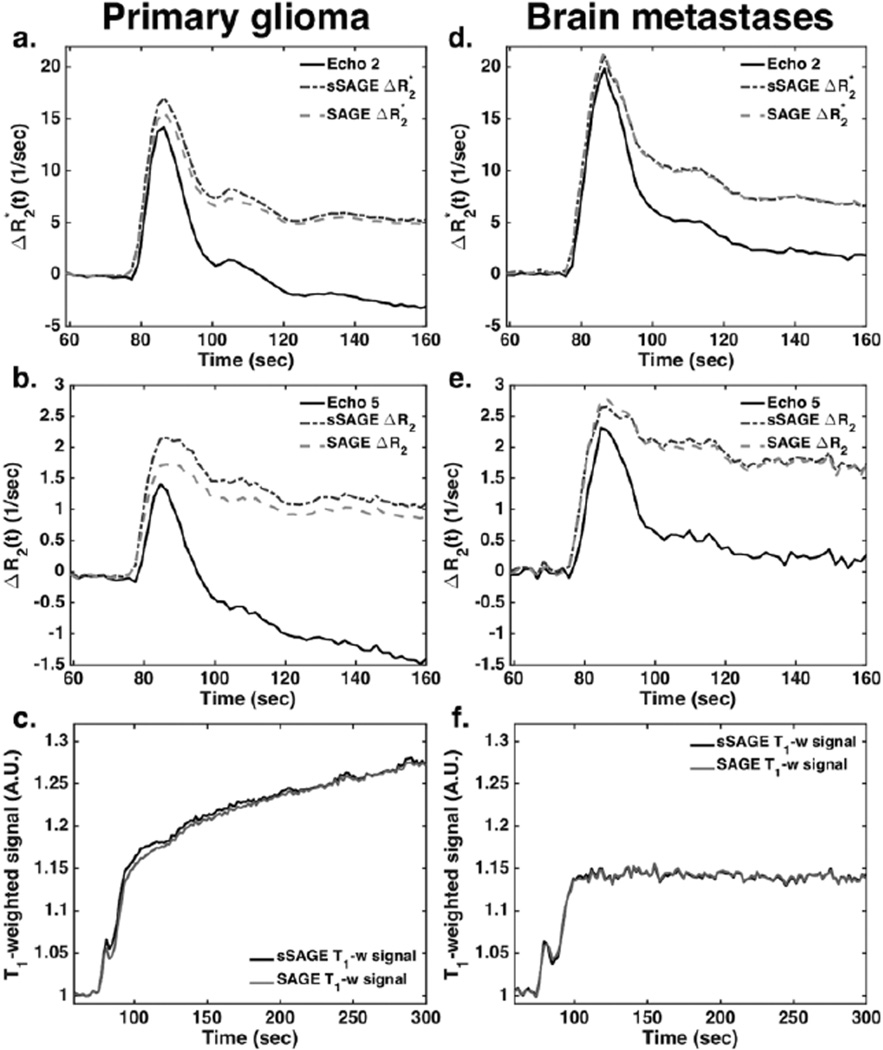
Figure 1.
Dynamic ΔR2* (a,b) and ΔR2 (c,d) time series for a tumor ROI in a primary glioma patient (a–c) and brain metastases patient (d–f) following bolus injection of 0.1 mmol/kg Gd-DTPA. The sSAGE and SAGE-based T1-weighted signals in a tumor ROI are also shown for each patient (c,f). In each case, the sSAGE and SAGE measures are similar, while the single-echo time-series are much lower, particularly at time points following the first pass of the contrast agent.

