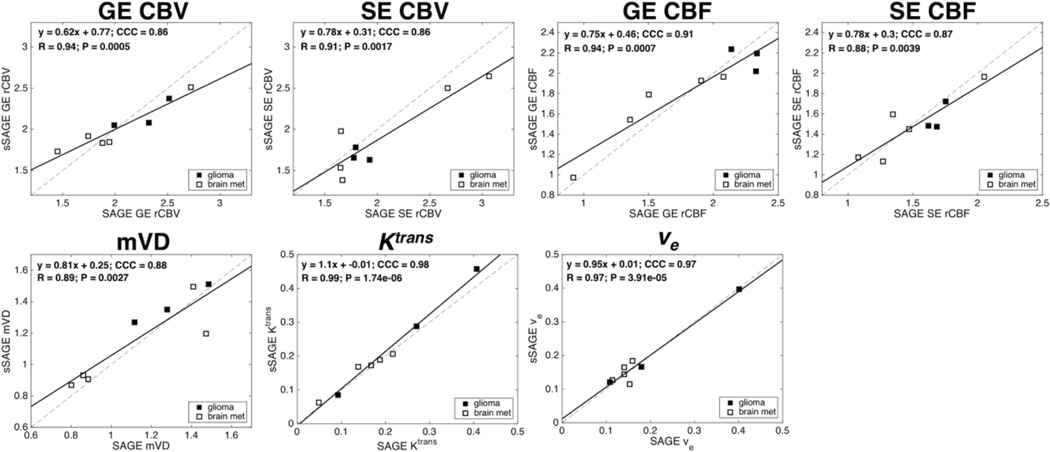
Figure 5.
Scatter plots showing mean GE and SE rCBV, GE and SE rCBF, mVD, Ktrans and ve from sSAGE and SAGE across all patients (n = 8; brain met patients are indicated by open markers). The linear regressions (slope and intercept, CCC, R and p-value) are shown for each plot, with significant correlations for each parameter.

