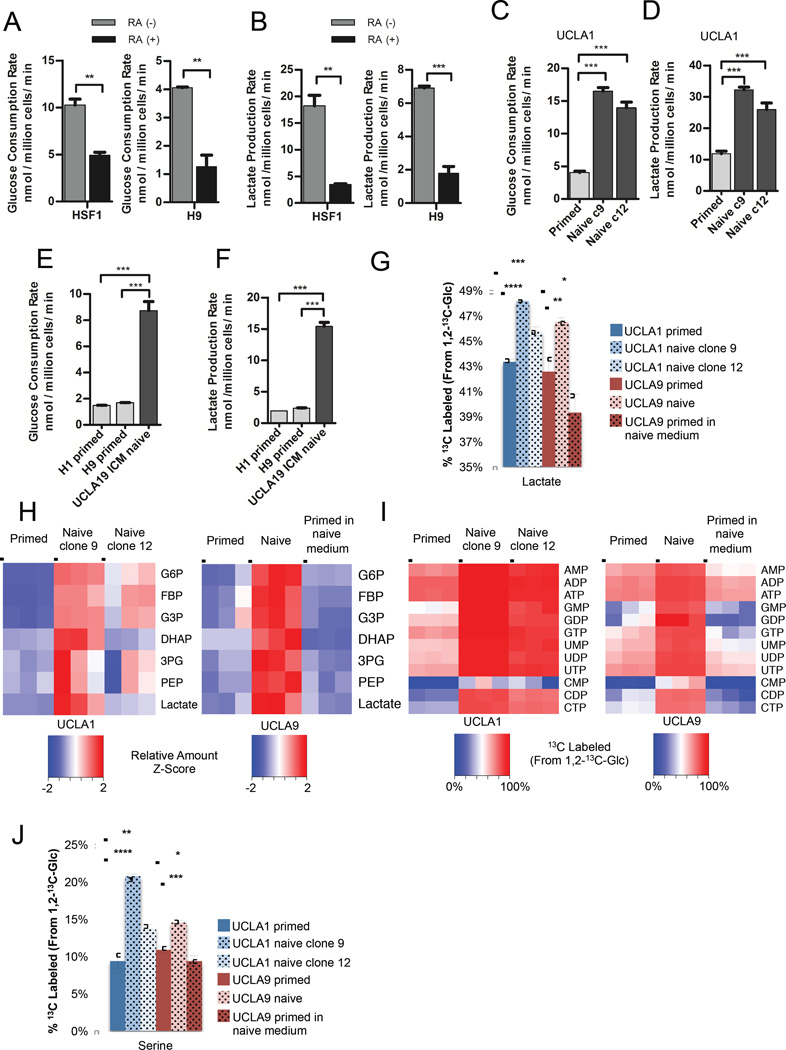
Figure 1. Naive hESCs exhibit increased glycolysis.
Glucose consumption rates (A) and lactate production rates (B) of primed feeder-free HSF1 and H9 hESCs treated for 7 days with DMSO (RA (-)) or 10 µM retinoic acid (RA (+)). Glucose consumption rates (C) and lactate production rates (D) of primed UCLA1 hESCs and naive UCLA1 hESC clone 9 and clone 12 generated by the 5i/LAF method. Glucose consumption rates (E) and lactate production rates (F) of primed H1 and H9 hESCs, and naive UCLA19 hESCs derived from the inner cell mass of a human blastocyst and cultured in 5i/LAF medium. For (G) – (J), primed UCLA1 hESCs, naive UCLA1 hESC clone 9 and clone 12, and primed UCLA9 hESCs, naive UCLA9 hESC, and primed UCLA9 hESCs placed in naive cell medium, were cultured in medium containing 1,2-13C-glucose for 24 hours prior to metabolite extraction and analysis by LC-MS. (G) Percentages of 13C-labeled lactate extracted from the indicated cells. (H) Relative amounts of glycolytic intermediates, glucose-6-phosphate (G6P), fructose bisphosphate (FBP), glyceraldehyde-3-phosphate (G3P), dihydroxyacetone phosphate (DHAP), 3-phosphoglycerate (3PG), phosphoenolpyruvate (PEP), and lactate, from the indicated cells. The heatmap shows standardized amounts of indicated metabolites across samples (Z score). (I) Percentages of 13C-labeled nucleotides extracted from the indicated cells. (J) Percentages of 13C-labeled serine extracted from the indicated cells. For (A) – (G), and (J), error bars indicate ± 1 SEM of biological replicates (n = 3). * p < 0.05; ** p < 0.01; *** p < 0.001; **** p < 0.0001. See also Figure S1.

