
Figure 2.
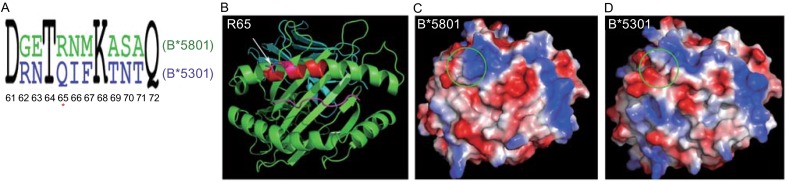
Comparison between HLA-B*5801 and HLA-B*5301. (A) Sequence alignment of HLA-B*5801 and HLA-B*5301 (residues 61–72). Only eight residues differ between the two HLA molecules, and the residue R65 which contributes to the large positive area in HLA-B*5801 is labeled with a star. (B) Ribbon drawing of HAL-B*5801 molecule viewing down the peptide-binding groove from the TCR perspective. The distinct residues between HLA-B*5801 and HLA-B*5301 are in red region and cluster at the α1-helical region of HLA molecule. The R65 is labeled and highlighted as sticker here. (C and D) Electrostatic potential surface representation in the same view as in the ribbon drawing in B, for HLA-B*5801 and HLA-B*5301 (PDB: 1A1M), respectively. The red color represents negative potential, the blue positive and the while color neutral. The most remarkable distinction between HLA-B*5801 and HLA-B*5301 is highlighted as a circle