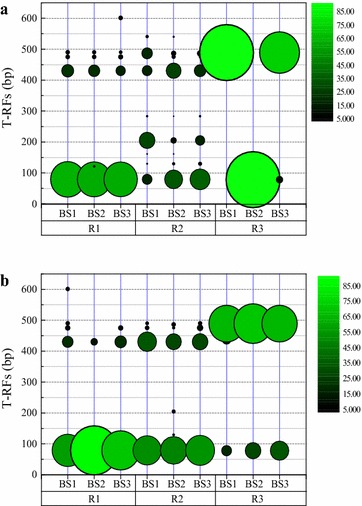
Fig. 3.

Distribution of T-RFs relative abundance of the biofilm samples along the flowpath of DNBF. a captured biofilm, b attached biofilm. R1, R2 and R3 were acetate, ethanol and methanol-fed DNBF. BS1, BS2 and BS3 were biofilm sampling at 0, 200 and 400 mm from the bottom of the filter layer
