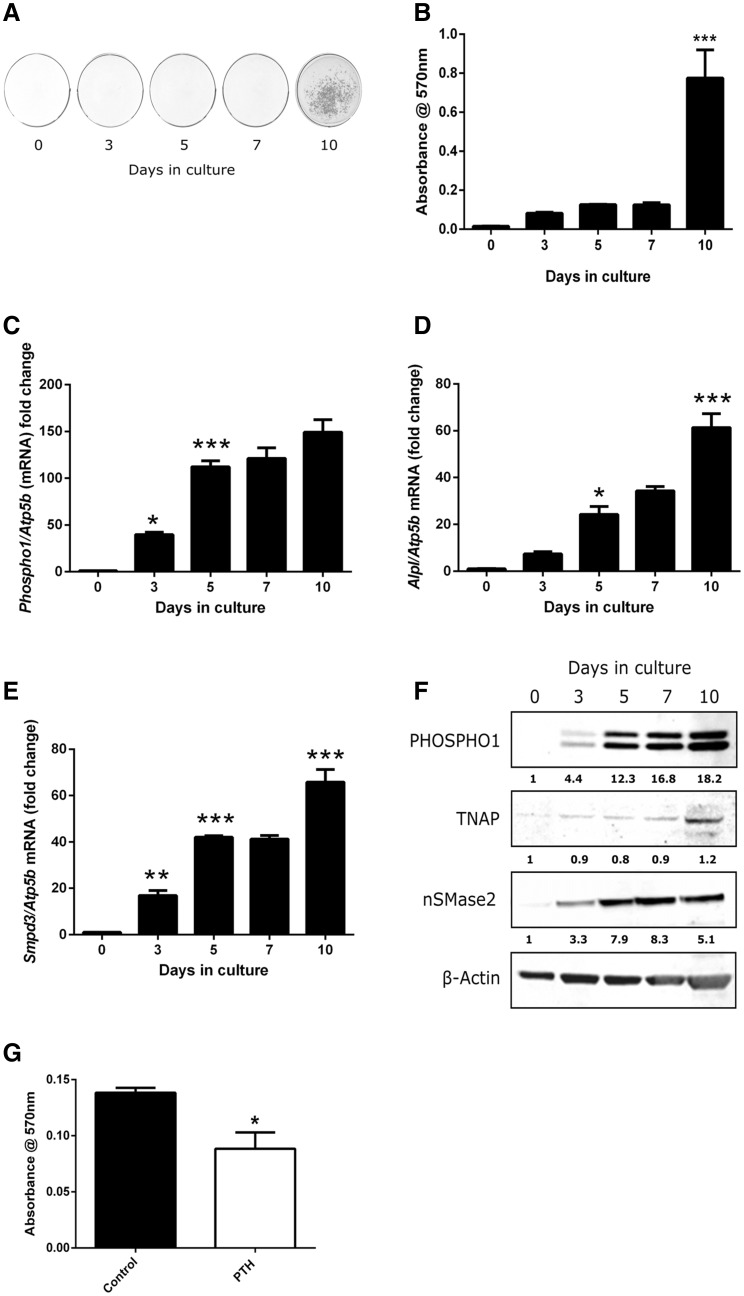
Fig. 1.
Extracellular matrix mineralisation and temporal gene expression in MC3T3-C14 cells. a Alizarin red staining and b relative quantification of cetylpyridinium chloride leached bound dye. RT-qPCR analysis of c Phospho1 d Alpl and e Smpd3 mRNA expression in mineralising MC3T3-C14 cells over a 10-day culture period. f Western blotting analysis of PHOSPHO1, TNAP and nSMase2 in MC3T3-C14 cells over a 10-day culture period. The fold change in fluorescence intensity against cultures at day 0 (normalised against beta-actin) is shown below each protein of interest. g Assessment of matrix mineralisation in MC3T3-C14 cell cultures continuously exposed to PTH for 10 days. Quantification of, cetylpyridinium chloride leached, bound Alizarin red staining. N = 3; *P < 0.05, **P < 0.01; ***P < 0.001 in comparison with the previous time point in culture

