FIG 4.
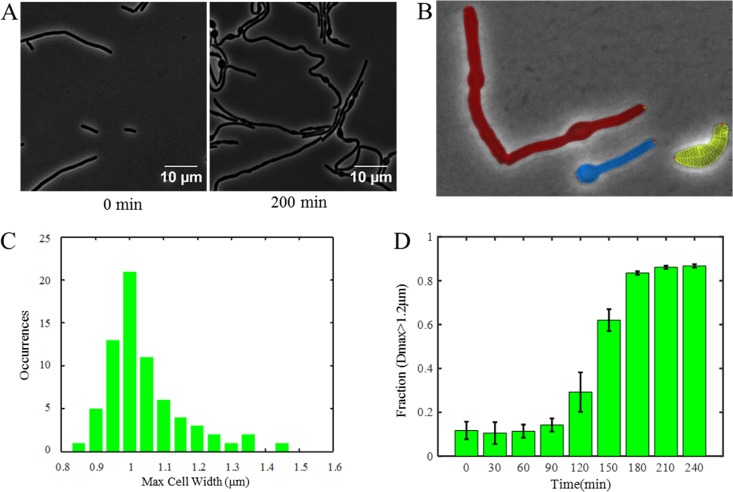
UPP-Pase depletion leads to curved and bulged cells. Microscopy images of depletion strains under depletion conditions. Cells were observed by phase-contrast microscopy under ×100 magnification (each pixel size is 65 nm). (A) Depletion strain (HB17235) growing in CH medium supplemented with 2% xylose at 37°C. Cells showed normal morphology at the beginning of the experiment (0 min) and showed curved and bulged morphology as UPP-Pases were depleted (200 min). (B) Example showing how cell width was measured. Lines were drawn across the cell width, and the cell width at each line was measured. The maximum width of each cell was used for quantification. (C) Distribution of maximum cell widths of depletion strain at the beginning of treatment (0 min). The majority of cells had a maximum width of 0.95 to 1.05 μm, while approximately 10% of cells had a maximum width greater than 1.2 μm. (D) Changes in fraction of cells having maximum cell width (Dmax; maximum diameter of cells) greater than 1.2 μm through time. The fraction increased significantly after 120 min and reached its peak after 180 min, indicating that more and more cells began to form bulges as UPP-Pases were depleted. Error bars show standard deviations.

