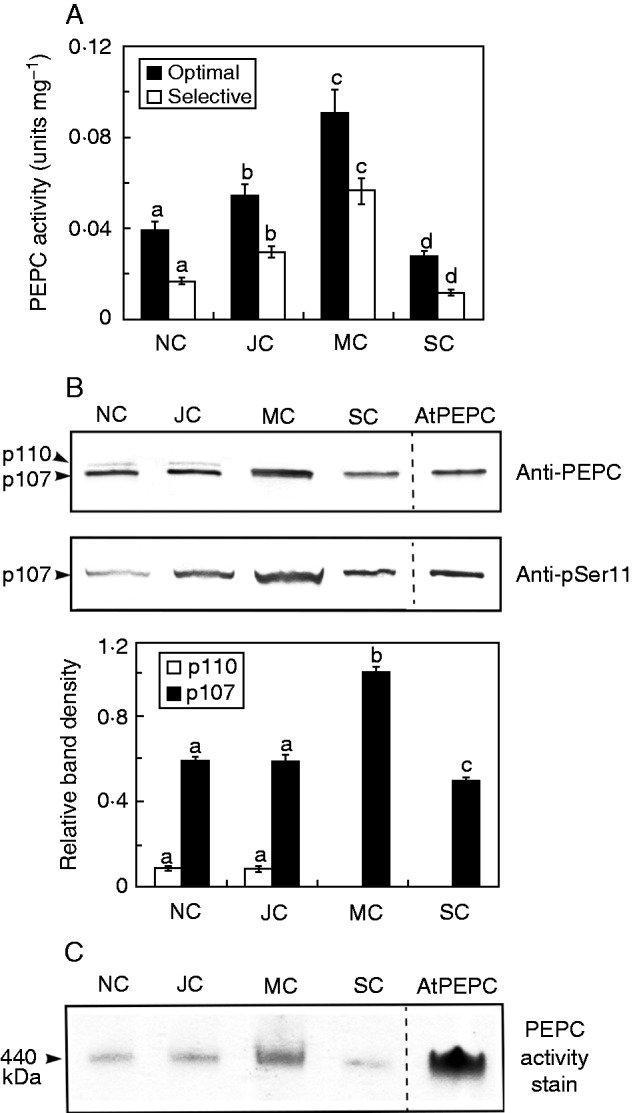
Fig. 2.

Developmental profiles for cluster root PEPC activity, abundance, subunit structure and phosphorylation status. NC, JC, MC and SC denote non-cluster, juvenile cluster, mature cluster and senescing cluster roots, respectively, as outlined in Fig. 1. (A) All values represent the mean (± s.e.m.) of PEPC activity from triplicate determinations of desalted extracts from n = 5 biological replicates determined under optimal (pH 8·2, 2·5 mm PEP) and selective (pH 7·2, 0·2 mm PEP, 0·125 mm malate) assay conditions. Different letters denote significant differences (Student’s t-test, P < 0·05) from the respective maximal value. (B) Extracts were subjected to SDS–PAGE, electroblotted onto a PVDF membrane and probed with anti-PEPC or anti-pSer11 antibodies (1 and 20 µg CR protein/lane, respectively). The lanes of the anti-PEPC and anti-pSer11 blots labelled ‘AtPEPC’ contained 50 and 100 ng, respectively, of in vivo phosphorylated AtPPC1 purified from −Pi arabidopsis suspension cells (Gregory et al., 2009). Relative amounts of immunoreactive p110 and p107 were quantified from scanned anti-PEPC immunoblots of n = 5 biological replicates using ImageJ. Different letters denote significant differences (P < 0·05) from the respective initial value. (C) In-gel PEPC activity staining was performed following non-denaturing-PAGE (8 µg CR protein/lane). The lane labelled ‘AtPEPC’ contained 0·25 µg of native AtPPC1 purified from −Pi arabidopsis suspension cells (Gregory et al., 2009).
