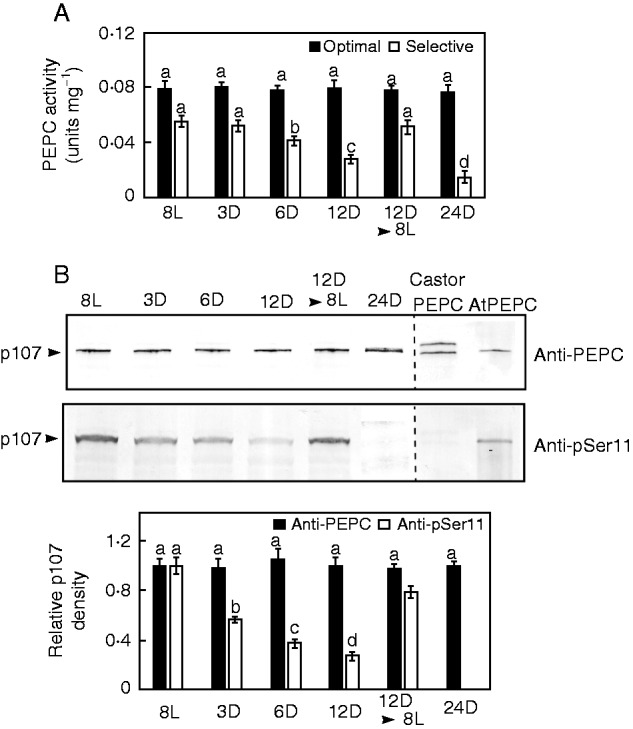
Fig. 3.

Influence of various light and dark pretreatments on cluster root PEPC activity, abundance and phosphorylation status. For panels (A–C), 8L, 3D, 6D, 12D, 8L and 24D denote the number of hours plants were exposed to constant light (L) or darkness (D), whereas 12D▸8L indicates plants that were subjected to darkness for 12 h and then reilluminated for an additional 8 h. (A) All values represent the mean (± s.e.m.) PEPC activity from triplicate determinations of desalted extracts from n = 5 biological replicates determined under optimal (pH 8·2, 2·5 mm PEP) and selective (pH 7·2, 0·2 mm PEP, 0·125 mm malate) conditions. Different letters denote significant differences (Student’s t-test, P < 0·05) from the respective initial, 8L value. (B) Extracts were subjected to SDS–PAGE, electroblotted onto a PVDF membrane and probed with anti-PEPC or anti-pSer11 antibodies (0·5 and 20 µg CR protein/lane, respectively). Relative band intensities (± s.e.m.) were quantified on n = 5 biological replicates from scanned immunoblots using ImageJ. Different letters denote significant differences (P < 0·05) from the respective initial, 8L value. The lanes of the anti-PEPC and anti-pSer11 blots labelled ‘AtPEPC’ contained 50 and 100 ng, respectively, of purified phosphorylated AtPPC1 from −Pi arabidopsis suspension cells (Gregory et al., 2009), whereas those labelled ‘Castor PEPC’ contained 50 and 250 ng, respectively, of dephosphorylated, partially monoubiquitinated PEPC purified from germinating castor beans (Uhrig et al., 2008).
