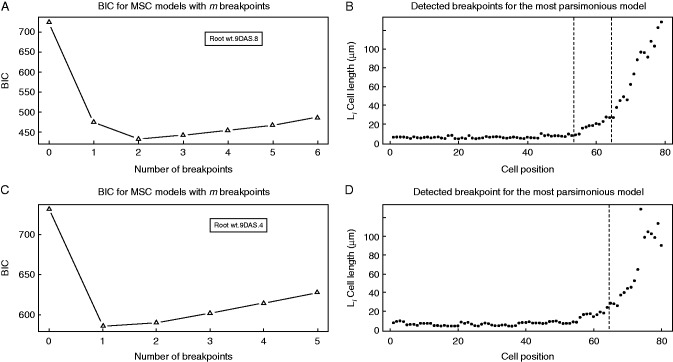
Fig. 2.
Estimation of the number of breakpoints and their position by an MSC–BIC approach in Col-0 wt cortical cell length profiles. (A, C) MSC–BIC models with m breakpoints for representative cell length profiles shown in (B) and (D). The lowest value of BIC corresponds to the most parsimonious model for number of breakpoints within a cell file. (B, D) Representative cell length profiles of wt 9-DAS seedlings. Vertical dashed lines represent the breakpoint position estimated by an MSC approach.

