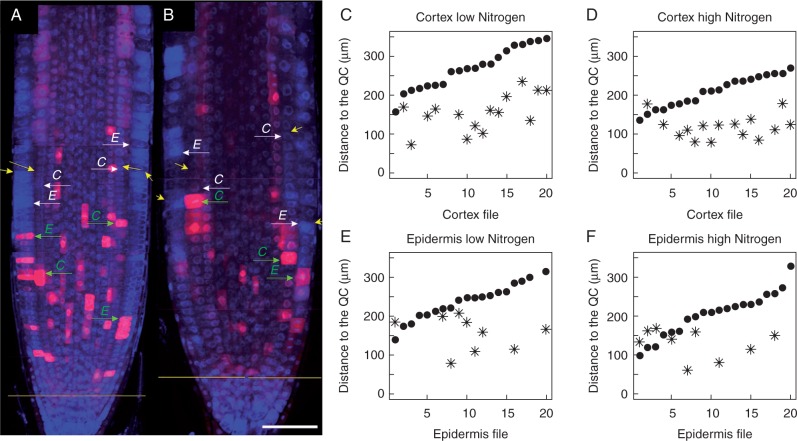
Fig. 3.
Distribution pattern of CycB1;1DB:GFP expression used as a molecular marker for PD determination and comparison of PD/TD border determinations by the ExpBiol method and MSC approach. (A, B) Root tip longitudinal median sections made by laser scanning confocal microscopy. GFP and DAPI channels were merged and images taken at different levels with respect to the root tip were assembled; the GFP signal is pseudo-coloured as magenta. (A) Roots grown on medium with 1 mm N. (B) Roots grown in medium with 30 mm N. Yellow arrows indicate the PD/TD boundary for cortex and epidermis files determined by ExpBiol based on changes in cell lengths or inter-nuclear distance; green arrows indicate the location within the PD where the cell expresses CycB1;1DB:GFP and is closest to the PD/TD boundary in epidermis (E) or cortex (C) files; white arrows indicate the PD/TD boundary determined by the MSC approach. Scale bar = 50 μm. (C–F) X-axis numbers indicate different cell files analysed (n=10 roots, one file of cortex and one file of epidermis for each root). The position of the last PD cell determined by the MSC approach (black dots) and the position of the cells closest to the PD/TD boundary which expresses GFP (asterisks) in epidermis and cortex files for low- and high-N media are shown. Note that not each cell file had cells expressing CycB1;1DB:GFP at the moment of fixation. For each condition, cell files are arranged in ascending order of the number of cells in the PD determined by the MSC approach.

