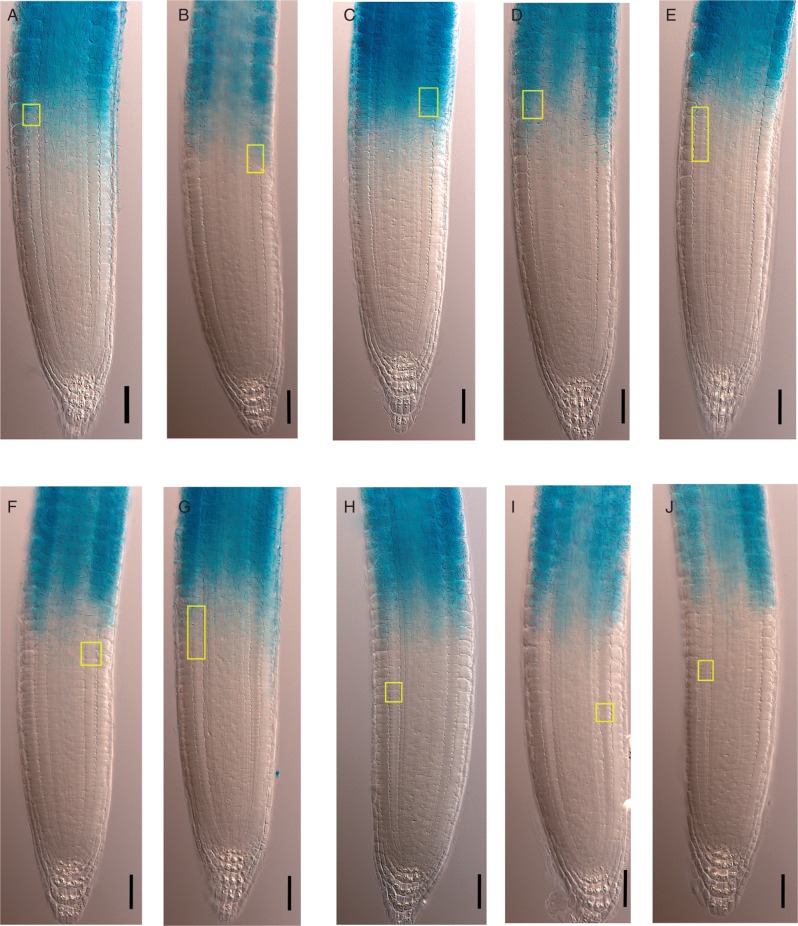
Fig. 4.
Determination of the PD/TD boundary in the CCS52A1:GUS line using the MSC approach; GUS expression marks the beginning of endoreduplication. (A–J) CCS52A1:GUS expression in wt roots (7 DAS) occurs in the TD and EZ. Yellow rectangles indicate the 95 % CI of the position of the last PD cell estimated by the MSC approach. Scale bar = 50 μm.

