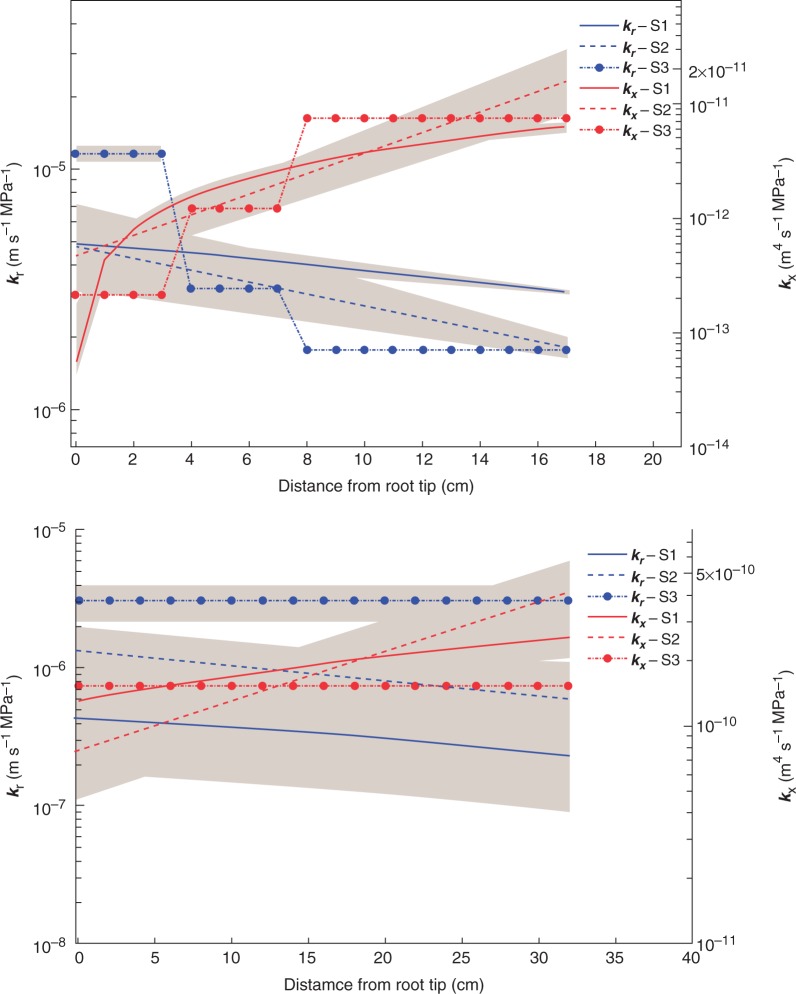
Fig. 2.
Profile of hydraulic conductivities as a function of distance from root tip. (A) Profile of radial conductivity (kr) and axial conductivity (kx) along lateral roots. (B) Profile of radial and axial conductivity along the taproot. We used three different scenarios to estimate the profile of the conductivities. In scenario 1 and 2, we imposed a linear and exponential function to estimate the profile of conductivities, respectively. In scenario 3, kr and kx of the lateral root were estimated using a step-wise function with three transition zones and those of the taproot were fitted to be homogenous along the taproot. The grey strips around the lines show the 95 % confidence interval of estimated conductivities. The data of kr and kx obtained from scenario 2 are given in Supplementary Data Tables S1 and S2.

