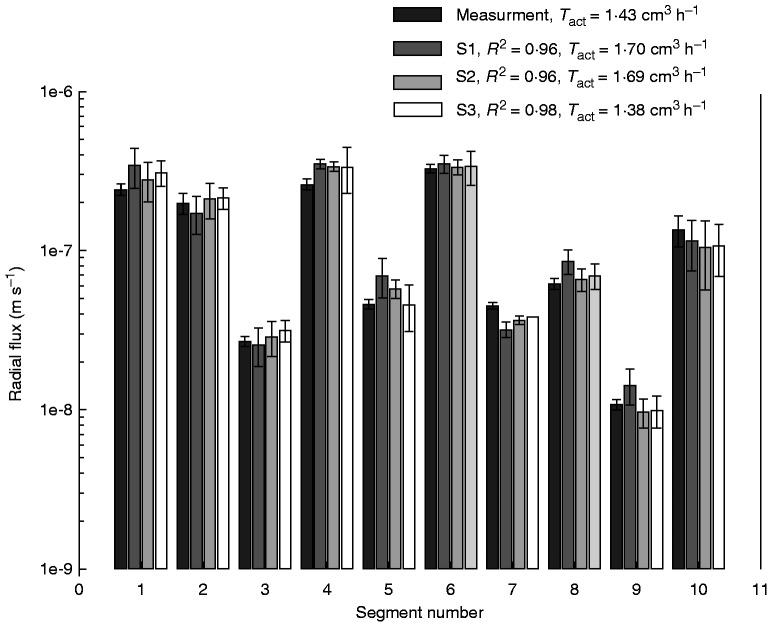
Fig. 3.
Measured and simulated radial fluxes into different locations along the root system illustrated in Fig. 1. Error bars show the standard deviations of average fluxes into different segment types (S1–S10). R2 refers to the correlation coefficient between measured and simulated fluxes, and Tact is the transpiration rate.

