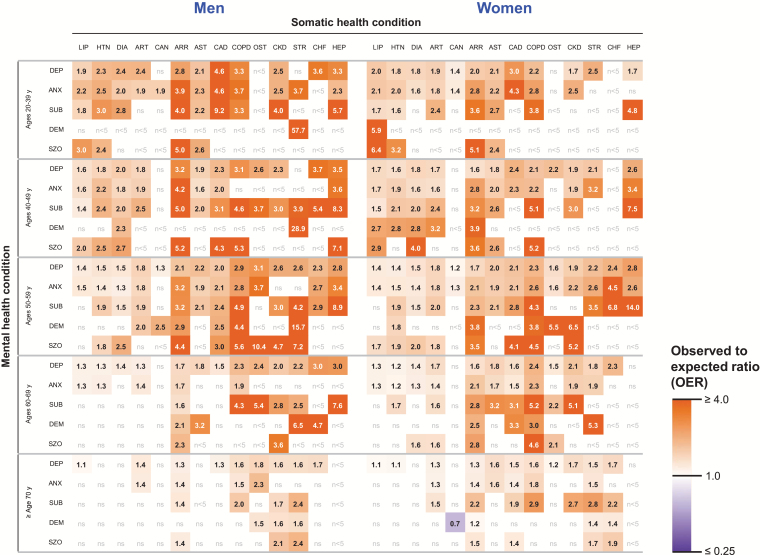
Figure 3.
Heat maps of a risk ratio obtained by dividing the observed frequency of each pair of conditions by the frequency expected assuming independent probabilities stratified by age and sex (observed-to-expected ratios; OERs). We only displayed OERs for dyads that occurred in five or more persons and that reached statistical significance. The hotter colors (orange) correspond to higher frequencies of co-occurrence than expected, whereas the cooler colors (purple) correspond to lower frequencies than expected. The 5 mental health conditions are presented in rows, and the 14 somatic health conditions are presented in columns; the color scale is shown on the right. The definitions of acronyms or abbreviations are: ANX = anxiety disorders; ARR = cardiac arrhythmias; ART = arthritis; AST = asthma; CAD = coronary artery disease; CAN = cancer; CHF = congestive heart failure; COPD = chronic obstructive pulmonary disease; CKD = chronic kidney disease; DEM = dementia and cognitive disorders; DEP = depressive disorders; DIA = diabetes; HEP = hepatitis; HTN= hypertension; LIP = hyperlipidemia; OST = osteoporosis; STR = stroke; SUB = substance abuse disorders; SZO = schizophrenia. N < 5 = the dyad was present in fewer than five patients. ns = the OER was not statistically significant.

