
Fig. 11.
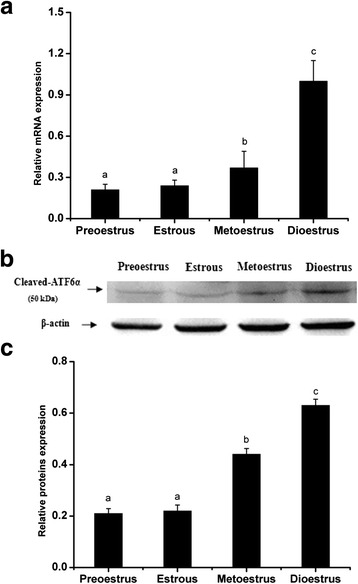
The expression levels of ATF6α mRNA and protein in the mouse uterus during the estrous cycle detected by RT-PCR (a) and western blotting (b and c), respectively(n ≥ 3). The results of statistical analysis are shown as histograms. Different lowercase letters on the bars indicate significant differences between specific two groups (‘a’ and ‘b’, ‘b’ and ‘c’, P < 0.05 or P < 0.01; ‘a’ and ‘a’, P > 0.05)