
Fig. 1.
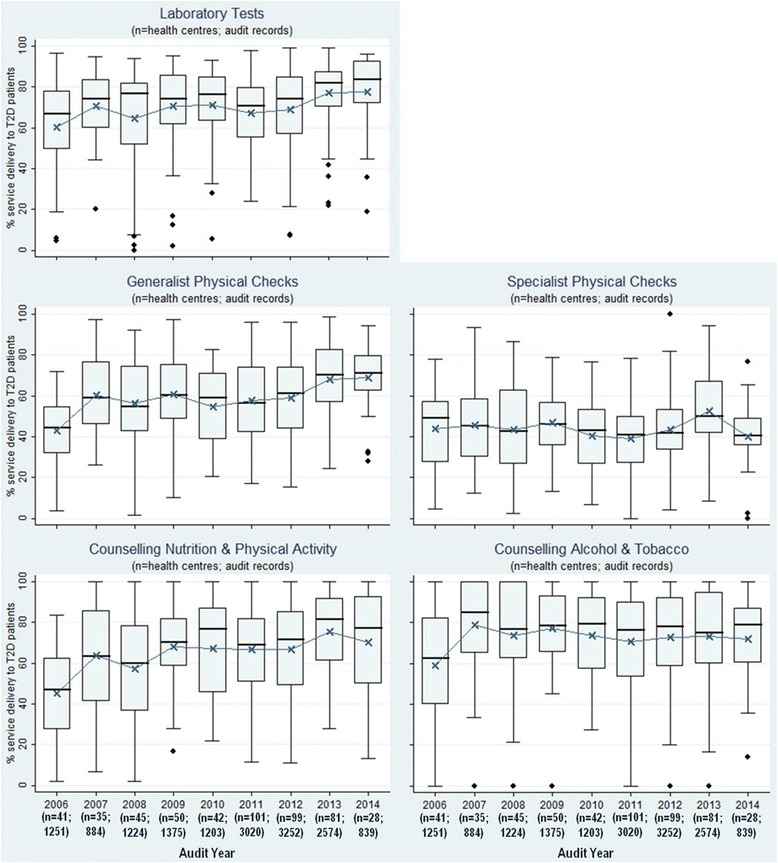
Type 2 diabetes service delivery over time by mode of care—(mean percent of the aggregate composite scores for each health centre for each mode of care)
Official websites use .gov
A
.gov website belongs to an official
government organization in the United States.
Secure .gov websites use HTTPS
A lock (
) or https:// means you've safely
connected to the .gov website. Share sensitive
information only on official, secure websites.
Type 2 diabetes service delivery over time by mode of care—(mean percent of the aggregate composite scores for each health centre for each mode of care)