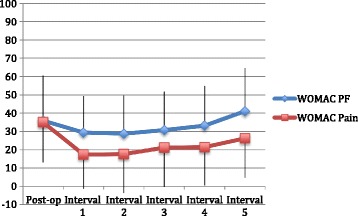
Fig. 2.

X-axis shows the time since TKA, including the baseline post-operative score at 6–12 months post-index TKA and the subsequent 12–24 month intervals. The Y-axis shows WOMAC pain and physical function (PF) scores, which are out of 100 points, with 0 being the best score and 100 being the worst score
