Fig. 3.

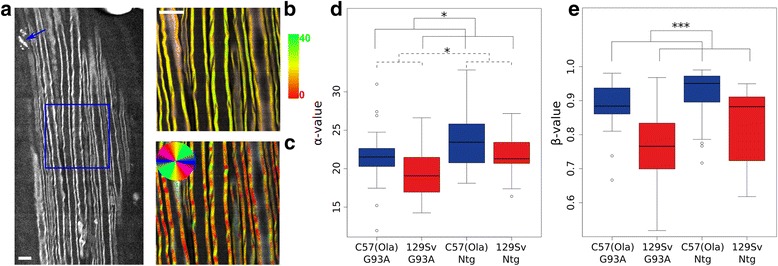
Myelin is more disorganized in sciatic nerves of 129Sv-SOD1G93A at disease onset. a Large-scale CARS image of a longitudinal optical section of a 129Sv-SOD1G93A mouse sciatic nerve. Myelin debris reminiscent of Wallerian axonal degeneration are indicated by a blue arrow. b Magnification of the blue square area in the panel a representative of anisotropy RP-CARS image highlighting the α value mapped onto the hue according to the color bar. c Bond-orientation RP-CARS image of the same area depicted in b mapping the φ value onto the hue. The saturation and the value of the images in a and b were constructed as previously described [15]. Scale bar, 10 μm. On average, 2.9 z-stacks, each composed of 10–11 slices (200 × 200 pixels per slice, corresponding to an area of 50 μm × 50 μm on the sample) were acquired for each nerve, and when possible, the sampling was performed at the proximal, the central, and the distal sections of the nerve. For all the mice except one, we observed both sciatic nerves. d, e Box plots showing the α value (d) and the β value (e) in the different conditions. *P value <0.05; ***P value <0.001 by general linear mixed model
