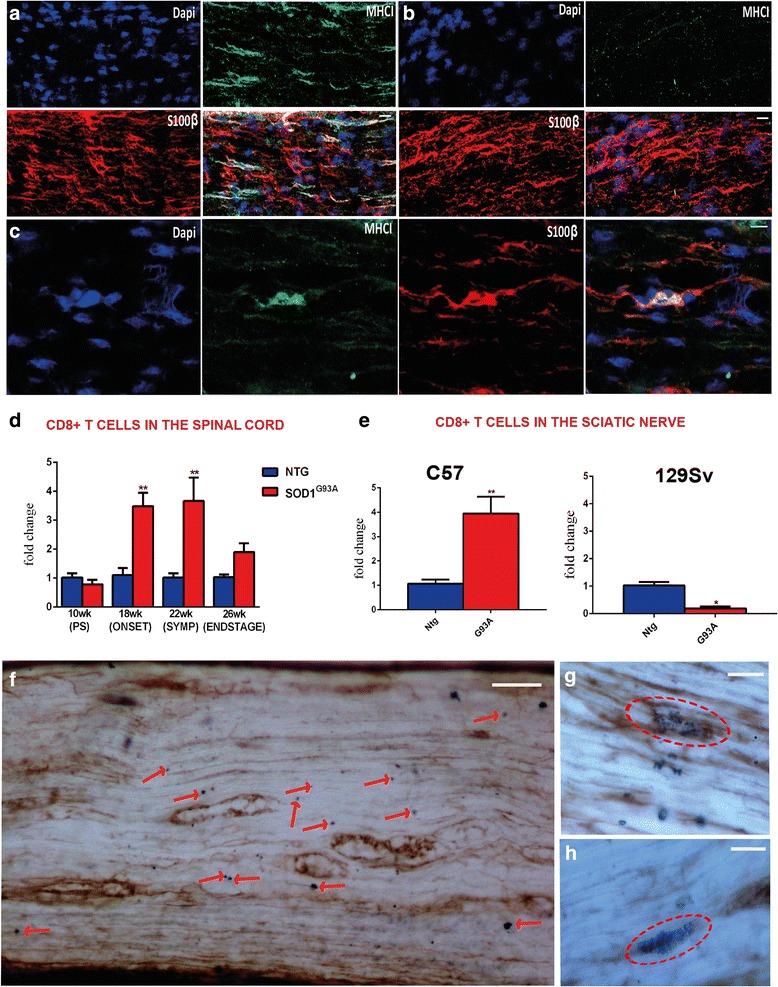
Fig. 5.

The greater expression of MHCI in the sciatic nerve of C57SOD1G93A mice leads to an increase in CD8+ T cell infiltration. a–c Confocal micrographs of longitudinal section of the sciatic nerve of the a C57SOD1G93A and b 129SvOD1G93A mice showing greater activation of MHCI (green) and c its co-localization with SCs (red) in the peripheral nerve of the less severe phenotype. CD8+ T cells specifically infiltrate the spinal cord, sciatic nerve, and hind limb muscles of C57SOD1G93A mice at disease onset. d Longitudinal real-time PCR for CD8 co-receptor transcript in the lumbar spinal cord of C57SOD1G93A mice compared to Ntg littermates. Data are normalized to β-actin and expressed as the mean (±SEM)-fold change ratio between n = 5 C57SOD1G93A and controls. **P value <0.01 by one-way ANOVA with Tukey’s post-analysis. e Real-time PCR for CD8 co-receptor transcript in the sciatic nerve of C57SOD1G93A and 129SvSOD1G93A mice compared to respective Ntg littermates at the symptom onset. Data are normalized to β-actin and expressed as the mean (±SEM)-fold change ratio between n = 5 C57SOD1G93A, n = 4 129SvSOD1G93A, and relative controls at disease onset. *P value <0.05; **P value <0.01 by Mann and Whitney test. f CD8+ T cells infiltrate the sciatic nerve of C57SDO1G93A mice in close proximity to degenerating motor axons expressing high levels of MHCI; (blue, CD8+ cells indicated by red arrows; brown, MHCI); (scale bar, 50 μm). g, h High magnification highlights CD8+ cell clusters wrapping MHCI+ motor axons (scale bar 20 μm)
