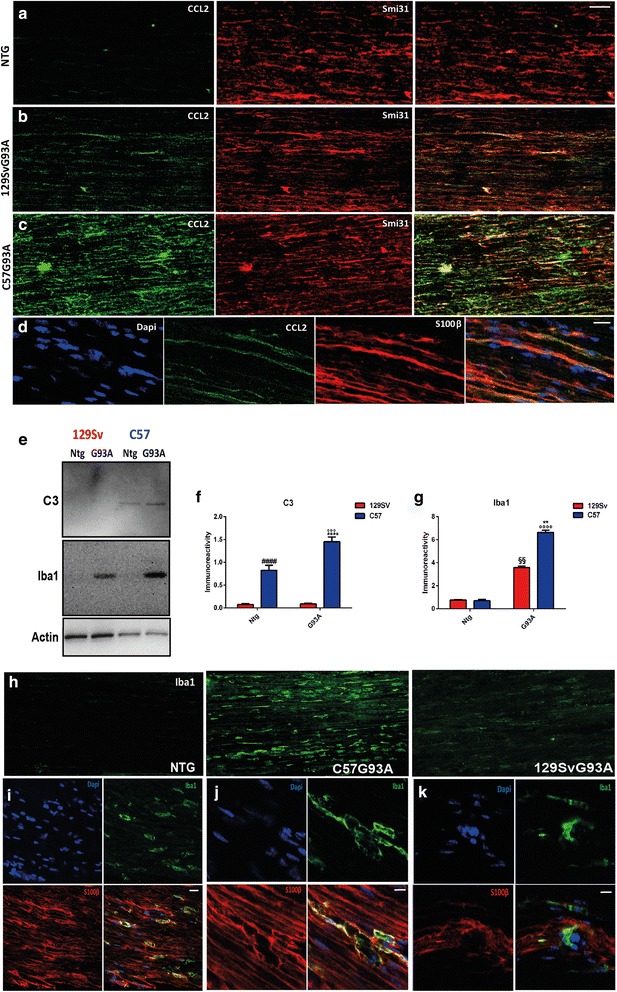
Fig. 6.

The C57SOD1G93A mice have greater macrophagic activity than the 129SvSOD1G93A in the sciatic nerve at disease onset. a–c Confocal micrographs show higher levels of CCL2 (green) in the sciatic nerve of C57SOD1G93A than 129SvSOD1G93A at disease onset and co-localization with the axonal marker Smi31 (red); scale bars, 50 μm. d Confocal micrographs showing the co-localization of the signal between CCL2 (green) and S100β (red) in the sciatic nerve of C57SOD1G93A mice at disease onset; nuclei were stained with Dapi (blue); scale bar, 20 μm. e Representative western blot images of Iba1 and C3 on sciatic nerve extracts from the C57SOD1G93A, 129SvSOD1G93A mice, and Ntg littermates at disease onset. Densitometric analysis indicates a correlation between the levels of activation of f C3 and the marked upregulation of g Iba1 expression in the C57SOD1G93A mice. The graph represents the mean ± SEM (n = 4 mice per group). ****P value <0.0001; **P value <0.01 (C57G93A vs 129SvG93A); °°°°P value <0.0001; °°°P value <0.005 (C57G93A vs 129SvNtg and or C57Ntg); §§ P value <0.01 (129SvG93A vs Ntg 129SvNtg and C57Ntg); #### P value <0.0001 (C57Ntg vs 129SvNtg and 129SvG93A) by two-way ANOVA with Tukey’s post-analysis. h Confocal micrographs showing higher levels of Iba1 (green) in the sciatic nerve of C57SOD1G93A at disease onset; scale bar, 50 μm. i, j Confocal micrographs of longitudinal section of sciatic nerve of the C57SOD1G93A mice showing the clear co-localization of signals between S100beta (red) and Iba1 (green); nuclei were stained with Dapi (blue); scale bars, (i) 20 μm; (j) 10 μm. k Confocal micrographs of longitudinal section of sciatic nerve of the C57SOD1 G93A mice showing the presence of Iba+ (green) S100β− (red) cells; nuclei were stained with Dapi (blue); scale bar, 10 μm
