
Figure 2.
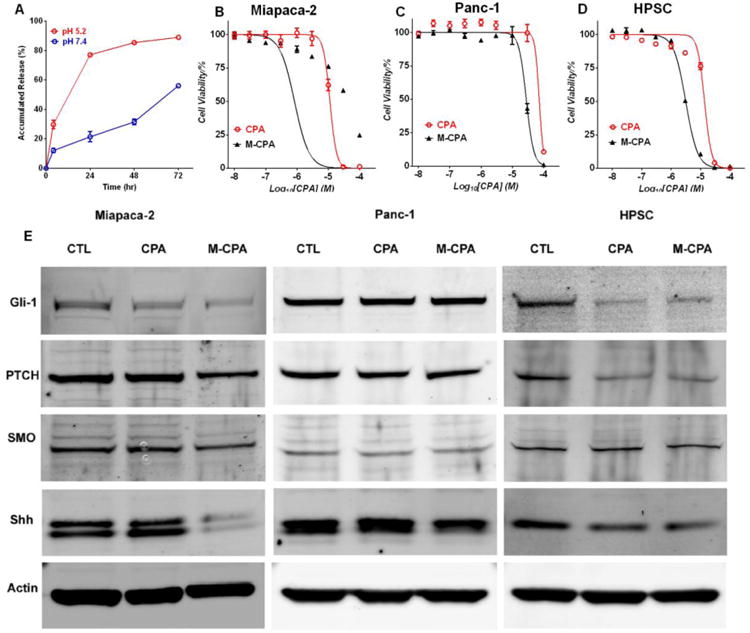
Effects of CPA and M-CPA on cell viability and SHH pathway in Miapaca-2, Panc-1 and HPSC cells. (A) CPA release profiles at 37 °C in pH7.4 and pH 5.2 buffers. (B-D) Cell viability after treatment with free CPA and M-CPA. Data points are presented as mean ± standard error of mean (N = 6) (E) Expression of SHH pathway proteins in Miapaca-2, Panc-1 and HPSC cells after treatment with CPA and M-CPA (both at 10 M CPA equivalent concentration). 30 μg protein was loaded into each lane for immunoblotting.