
Figure 4.
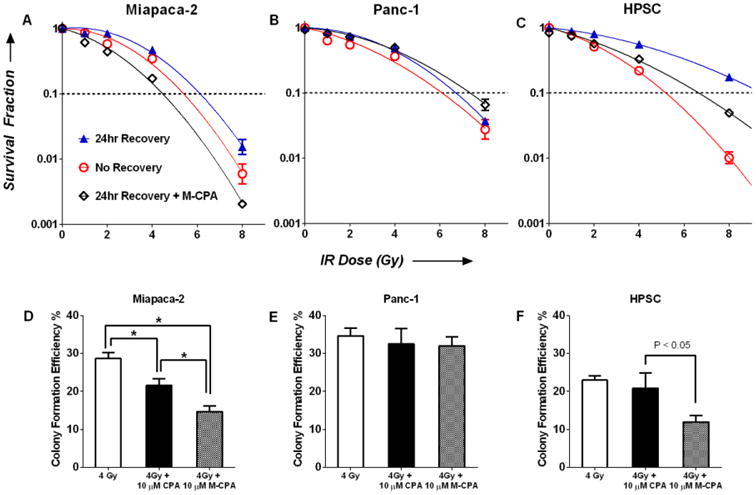
Clonogenic survival of Miapaca-2 (A), Panc-1 (B), and HPSC (C) cells as a function of IR dose. There were three treatment groups: no recovery (open red circle), 24-hr recovery (blue triangles) and 24-hr recovery with 10 μM M-CPA (open black diamond). Data are expressed as fraction of colonies formed relative to untreated cells (mean ± SEM, N = 4). Survival curves were fitted using Log10(survival fraction) = -α(Dose)-β(Dose)2. Mean inactivation dose (MID) was calculated as , see Ref 15a. (D-E) Efficiency of colony formation after 4Gy IR, 4Gy + 10 μM CPA, and 4Gy + 10 μM M-CPA.