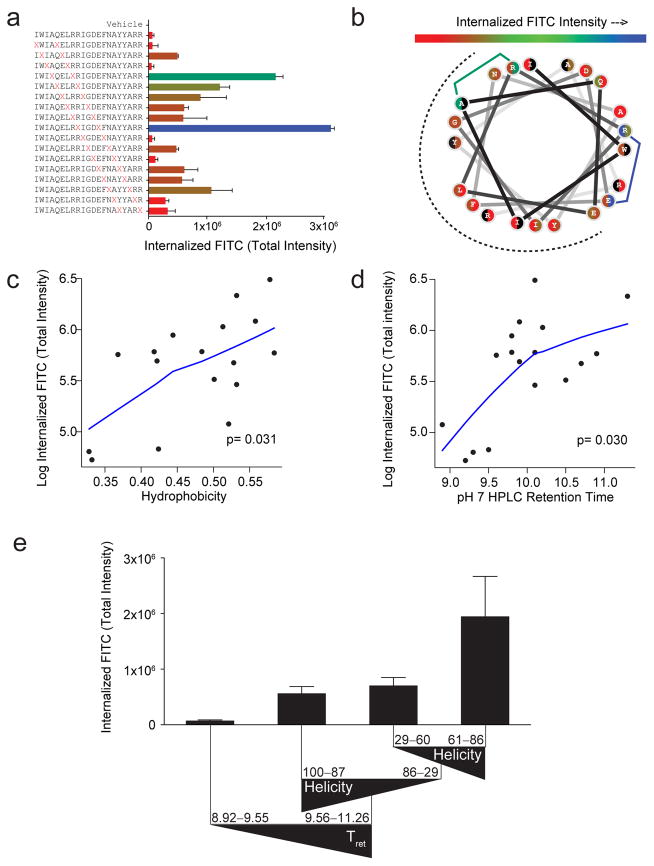
Figure 2. Determinants of cellular uptake for differentially stapled BIM BH3 peptides.
(a) Range of TIFI for BIM BH3 peptides bearing sequentially placed i, i+4 staples (red X pairs) for MEFs (2×10⁴/well) treated with 500 nM peptides and measured by IXM (20x) at 4 hours. Data are mean ± s.d. for experiments performed in duplicate wells with 4 image acquisitions per well. Three biological replicates were performed with similar results (see Supplementary Fig. S6a). X, S-pentenyl alanine (b) Wheel depiction of the BIM BH3 α-helix, with the hydrophobic interaction face indicated by the dotted surface and stapling amino acid pairs color-coded based on level of measured TIFI. Residues that participate in two distinct staples are shown as split circles, with the left and right colors corresponding to their roles in N- vs. C-terminal staples, respectively. (c–d) Single variable plots for TIFI vs. (c) calculated hydrophobicity and (d) HPLC retention time (pH 7), as assessed by Spearman’s rank correlation. p-values were calculated using the permutation test included in the R package pvrank, and line fitting was performed using a loess smoother. (e) The tree resulting from recursive partitioning depicts the influence of principal components (hydrophobicity/HPLC retention time, α-helicity, and pI) on TIFI outcome. Triangles reflect the directionality of parameter values. Retention time and α-helicity are indicated in minutes and percent, respectively. Data are mean ± s.d. for each peptide subpopulation.

