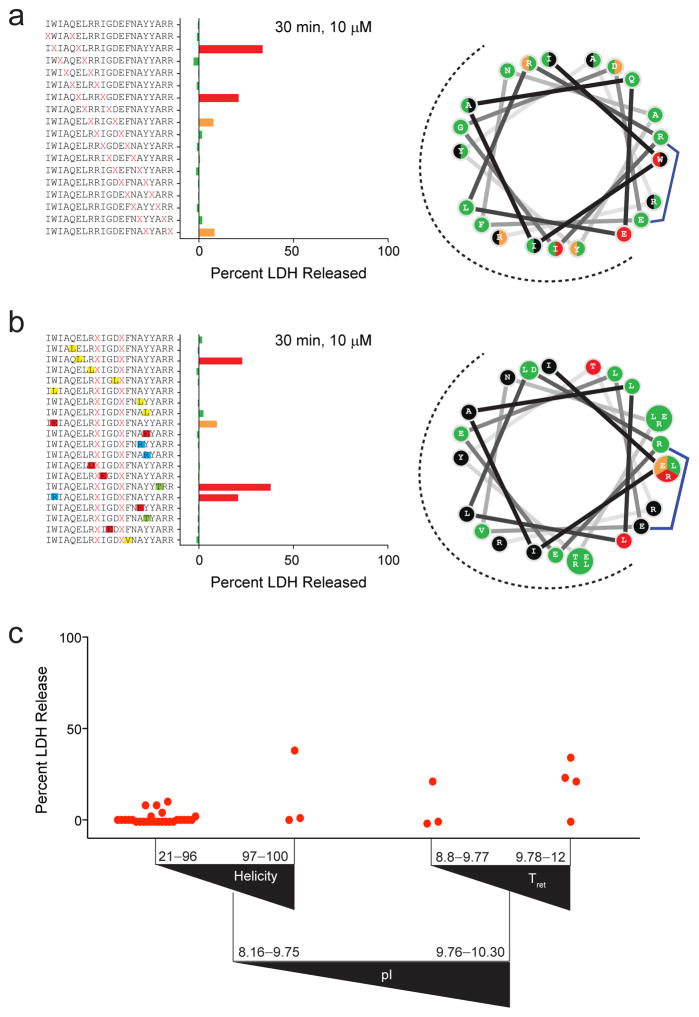
Figure 5. Determinants of cellular lysis for stapled BIM BH3 peptides.
(a) Staple scanning and (b) point mutant BIM BH3 peptide libraries were screened for membrane lytic properties by LDH release assay, performed on BCL-XL-reconstituted p185+Arf−/−Mcl-1del B-ALL cells (2×10⁴ cells/well) treated with 10 μM peptide for 30 minutes in the absence of added serum. Data are normalized based on the response to treatment with 1% Triton X-100 (100% release) and media alone (0% LDH release). Data represent the mean of technical duplicates. The experiments were repeated twice with similar results. The wheel depictions to the right demonstrate the discrete staple insertion (a) and point mutation (b) sites that give rise to lysis (green, no lysis; orange, low grade lysis; red, higher grade lysis). (c) Recursive partitioning analysis depicting the influence of pI, α-helicity, and HPLC retention time on LDH release outcome. Triangles reflect the directionality of parameter values and red dots are the mean percent LDH release values for each peptide.

