
Figure 3.
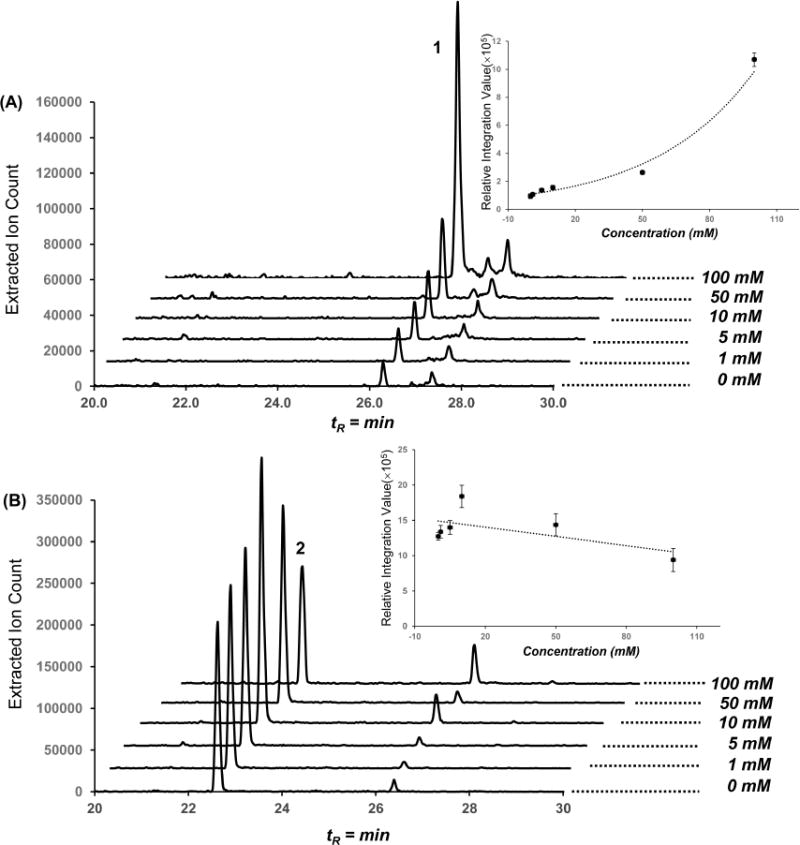
Production of 1 and 2 in dose-dependent 2-aminomalonic acid feeding experiments. HPLC traces with the extracted m/z 284 (A) and m/z 255 (B) ion signals from P. luminescens TT01 culture broth fed with varying concentrations of 2-aminomalonic acid. 2-Aminomalonic acid dose–response curve for 1 and 2 determined by product peak integration values. Error bars represent 95% standard deviation confidence limits.