
Figure 1.
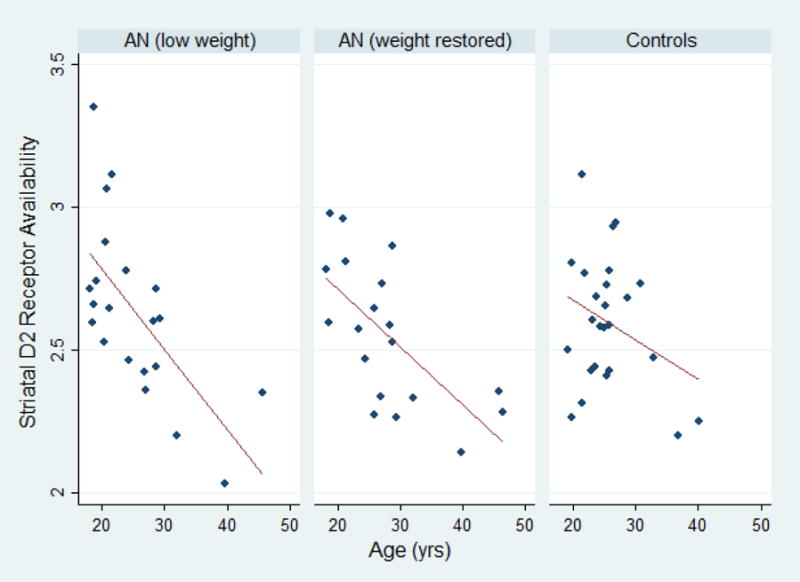
Distribution of striatal D2 receptor availability (“BPND”, unitless) vs. age. The left panel represents all measures in underweight patients with AN. The center panel represents all measures in weight-restored patients with AN. The right panel represents all measures in control subjects.