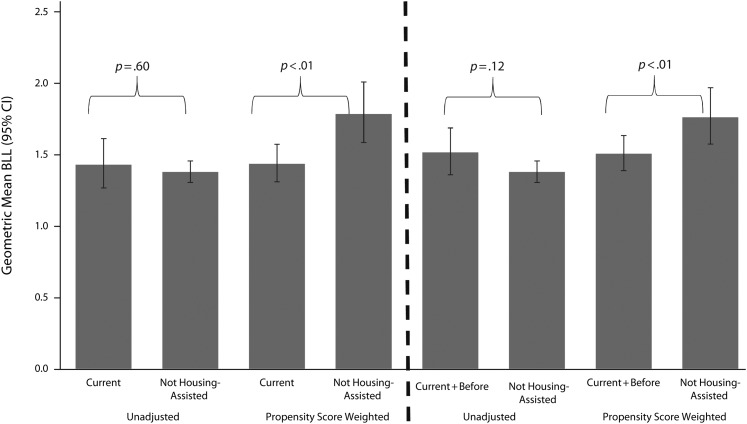
FIGURE 2—
Geometric Mean Blood Lead Levels Among US Children Aged 1–5 Years With Income-to-Poverty Ratios < 2.00, by Housing Assistance Status: National Health and Nutrition Examination Survey (NHANES), United States, 2005–2012
Note. BLL = blood lead level; CI = confidence interval. “Current” includes children in households receiving housing assistance at the time of the NHANES examination (n = 151). “Current+before” includes children in households receiving housing assistance before the NHANES examination, at the time of the NHANES examination, or both (n = 208). Not housing assisted includes children in households that did not receive housing assistance during 1999 to 2014 (n = 1099).

