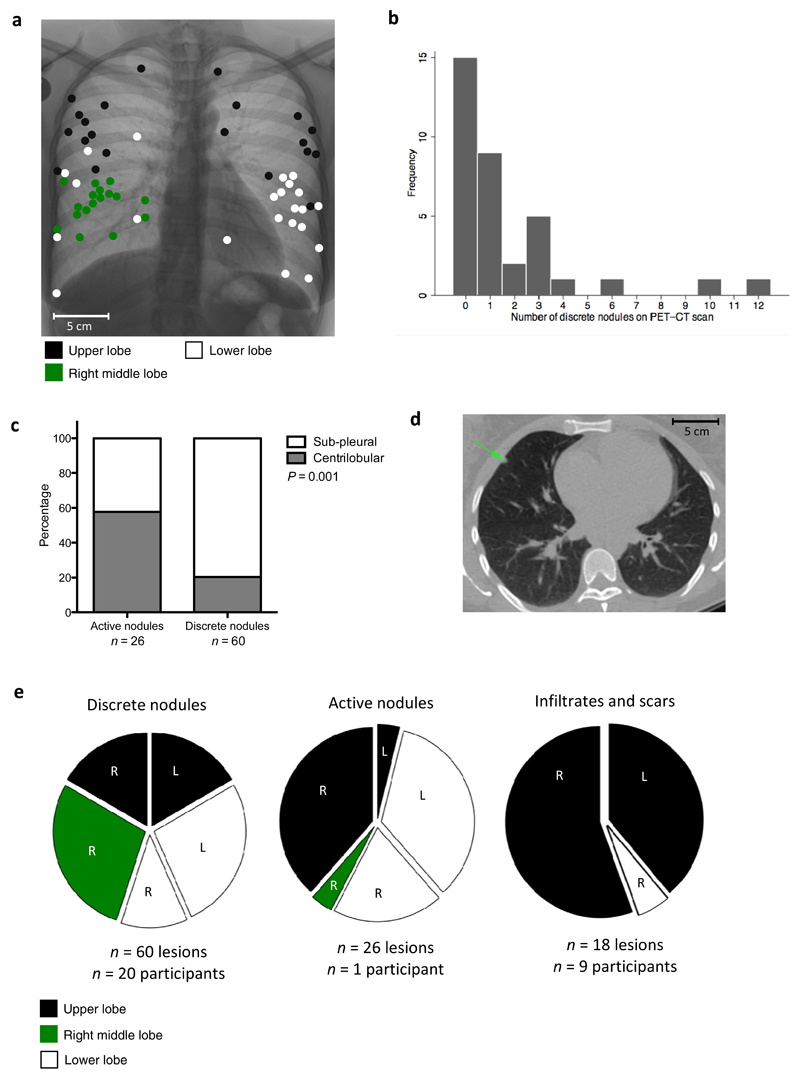
Figure 2. Radiological findings in participants with discrete nodules.
a – Spatial overview of the FDG-PET/CT location of 60 discrete nodules in 20 participants (15 of which did not have other types of lesions) in the coronal plane. Lesions are represented as filled circles with colour denoting lobar location.
b – Frequency distribution showing number of discrete nodules found in lung parenchyma per participant.
c – Graph showing differences in lobular distribution of discrete compared to active nodules. Discrete nodules are significantly more likely to have a sub-pleural rather than centrilobular location, P = 0.001 - χ2 test.
d – Example of a discrete nodule identified with green arrow on an axial section through CT scan.
e – Pie chart showing lobar distribution of discrete nodules, active nodules and infiltrates/scars.

